
Work with nexxus
Reports
Boards are named pages of tiles, with key figures from your data and views from your apps. You create one with a name, the AI Assistant suggests figures and builds views, you filter by period and values, share the board with colleagues and download it as a PDF. Every tile counts and reads with the rights of whoever looks at it.
A board is a page of figures on one topic: “Team hours” with the hours of the year, the hours per month and per project, or “Projects at a glance” with the number of projects, the customers and the billing model. It is made of tiles on a grid of four columns, with filters for the period and for single values above them. You find the boards under StartReports (/analytics).
A tile is one of two things. A key figure tile counts from your tenant’s data, for example hours per project. A view tile shows data from your connected apps, for example your team’s open tickets as a table with status. Both sit side by side on the same board.
The dashboard knows the same tiles (see Build your dashboard). A board does more: you can have as many as you like, each with a name, share them, filter all tiles at once and pass them on as a PDF. The dashboard stays your personal start page.
Name
A new board needs nothing but a name.
Suggestions
The AI Assistant opens beside it and suggests figures from your data.
Confirm
You confirm every tile on a card, and it appears at once.
Count
Every tile counts with the rights of whoever looks at it.
Before you start
Section titled “Before you start”- You need the permission Reports (
core.analytics.read). Every role the setup wizard creates includes it; older roles get it under Roles and rights. Without it, the menu entry is missing. - For each tile you also need the read permission of its data source, for example projects or time entries. The sources and the permission each one asks for are listed in the NQL reference.
- The AI Assistant’s suggestions need a connected AI model (see Connect your AI). Without one you build key figure tiles yourself.
- View tiles need at least one connector you may use (see What connectors are) and the AI model: only the AI Assistant builds views.
The overview
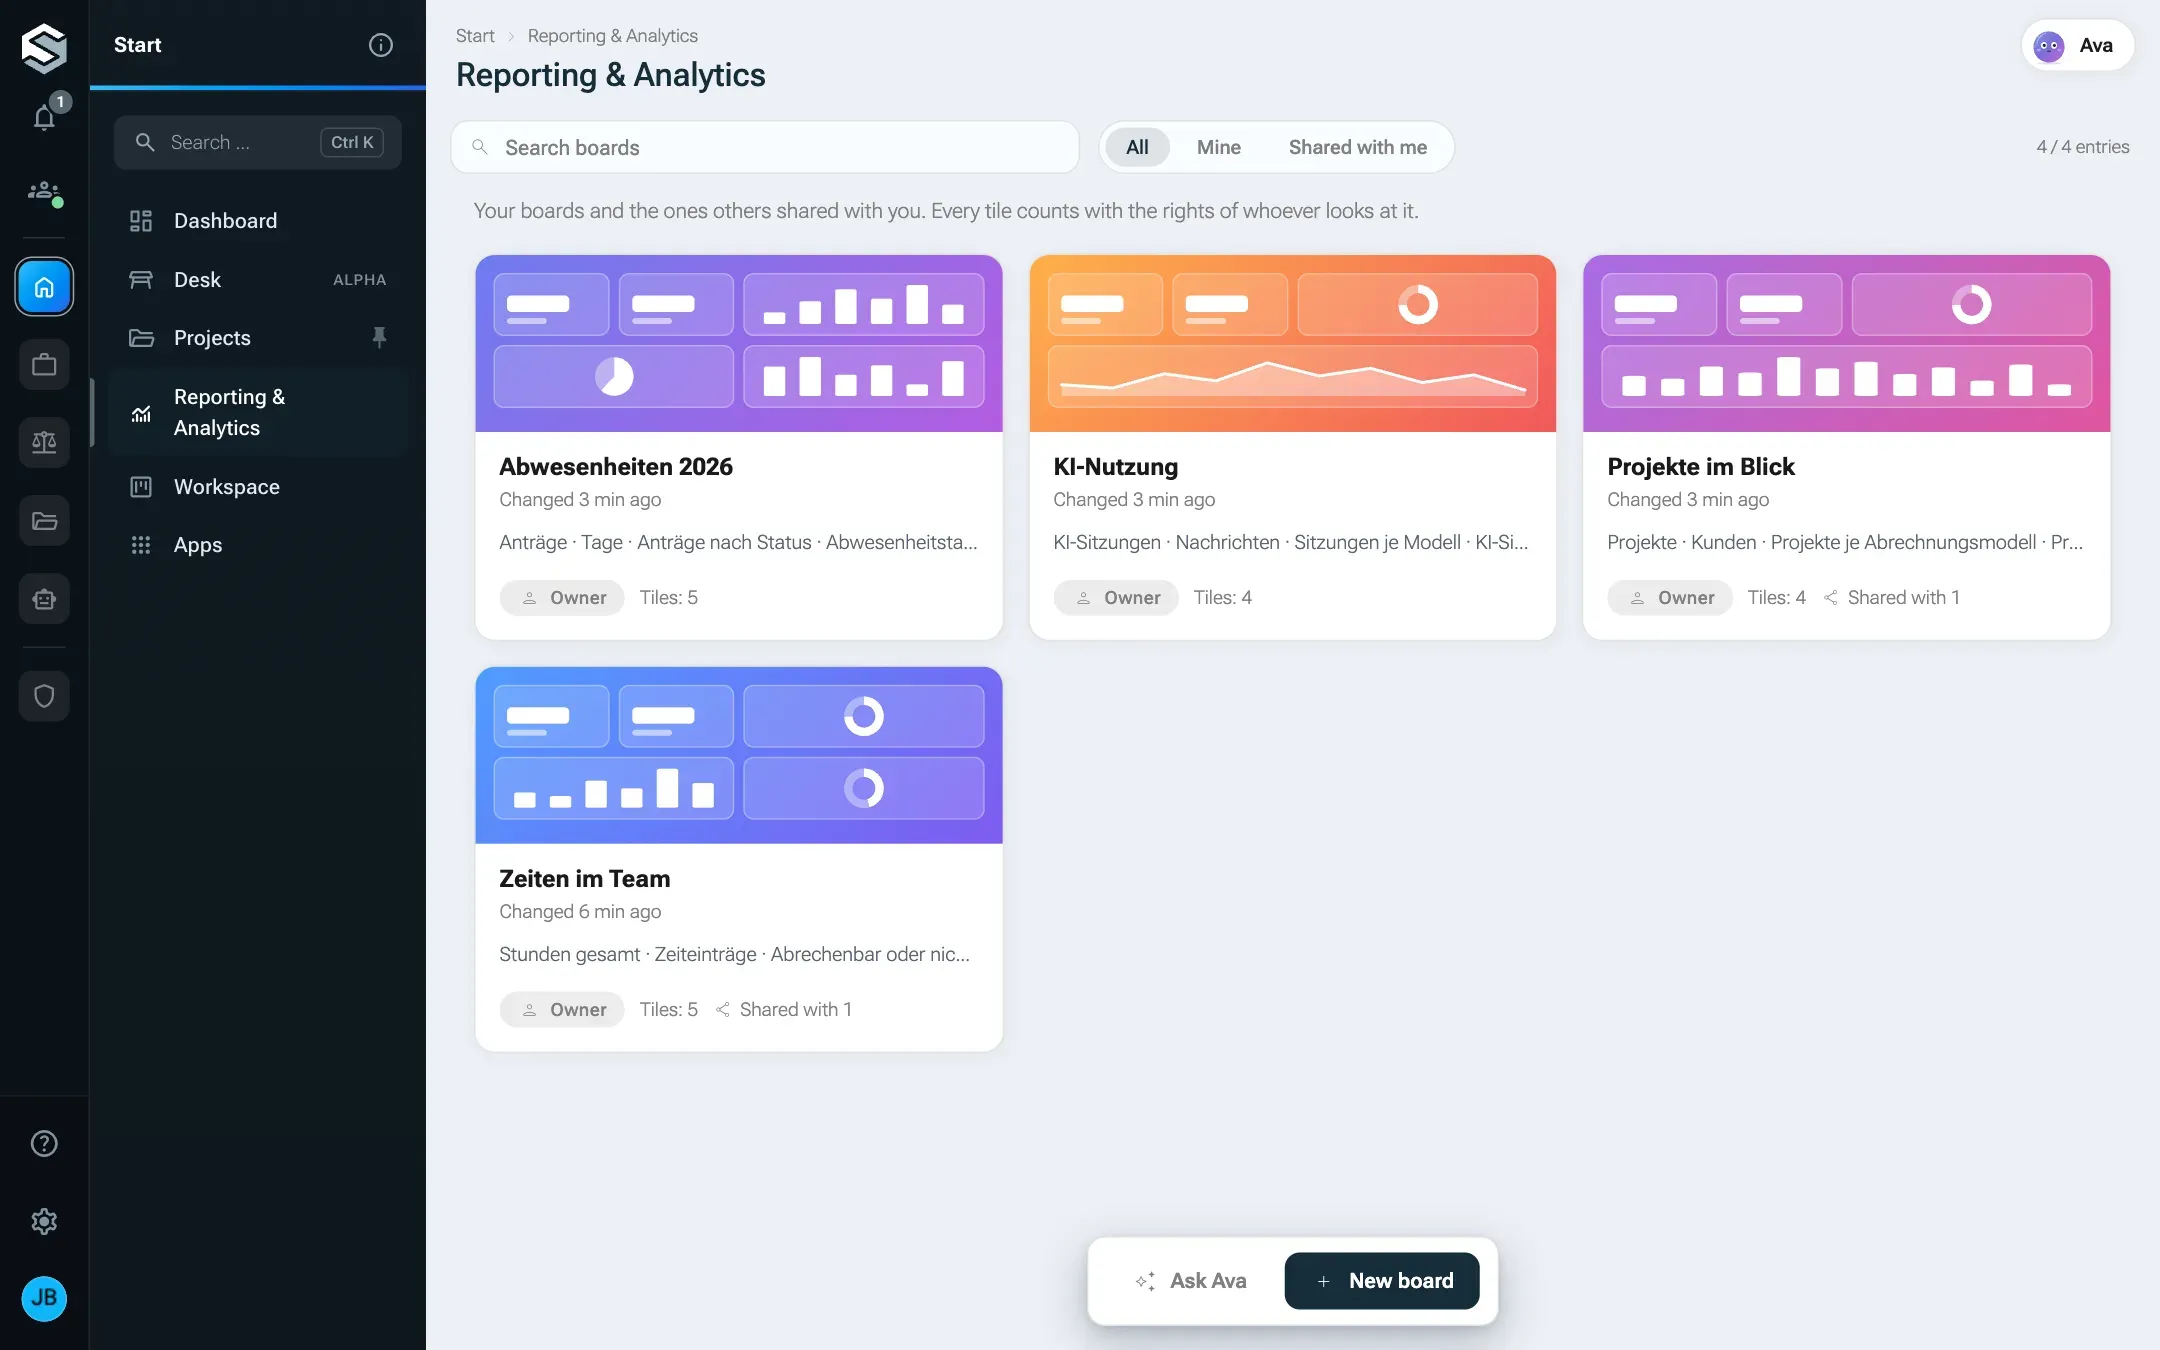
Section titled “The overview”The page Reports shows your boards and the ones others shared with you as cards. The tabs All, Mine and Shared with me separate them, Search boards searches the names.
Each card shows its board as a coloured miniature: the tiles in their width and their kind (figure, bar, line, doughnut, table), but without numbers. The numbers belong to whoever opens the board. Below are the name, Tiles: 5 or Still empty, on a shared board Shared with 2 or by and the owner’s name, and when it was last changed.
If you already have a view that stands on its own, from the time before views became tiles, it is in the overview too. Its card carries View and, instead of the tiles, the apps it reads from or Own page. New views are only made as tiles of a board.
Create a board
Section titled “Create a board”-
Click New board. The dialog only asks for the Name, for example “Hours and projects 2026”, at most 120 characters. Click Create.
-
The new board opens, and the AI Assistant opens beside it, asking what the board should show. Below are suggestions as buttons, built from the sources you may read, the ones with the most data first. The names of figures and fields come from the server in German, so for projects you see for example Key figure: Anzahl Projekte (number of projects), Anzahl Projekte per month, Anzahl Projekte by Abrechnungsart (billing model) and Top 5 Kunde by Anzahl Projekte (customer), plus Suggest filters.
-
Click a suggestion, or describe in your own words what you want to see, for example “hours per month by project”. The AI Assistant answers with a card that shows each planned tile as a step. Several tiles come as one bundle.
-
Check the card and click Execute, or for several steps Execute all 3. Nothing happens before that. The tiles appear on the board at once, and the AI Assistant keeps offering what is still missing above the input field.
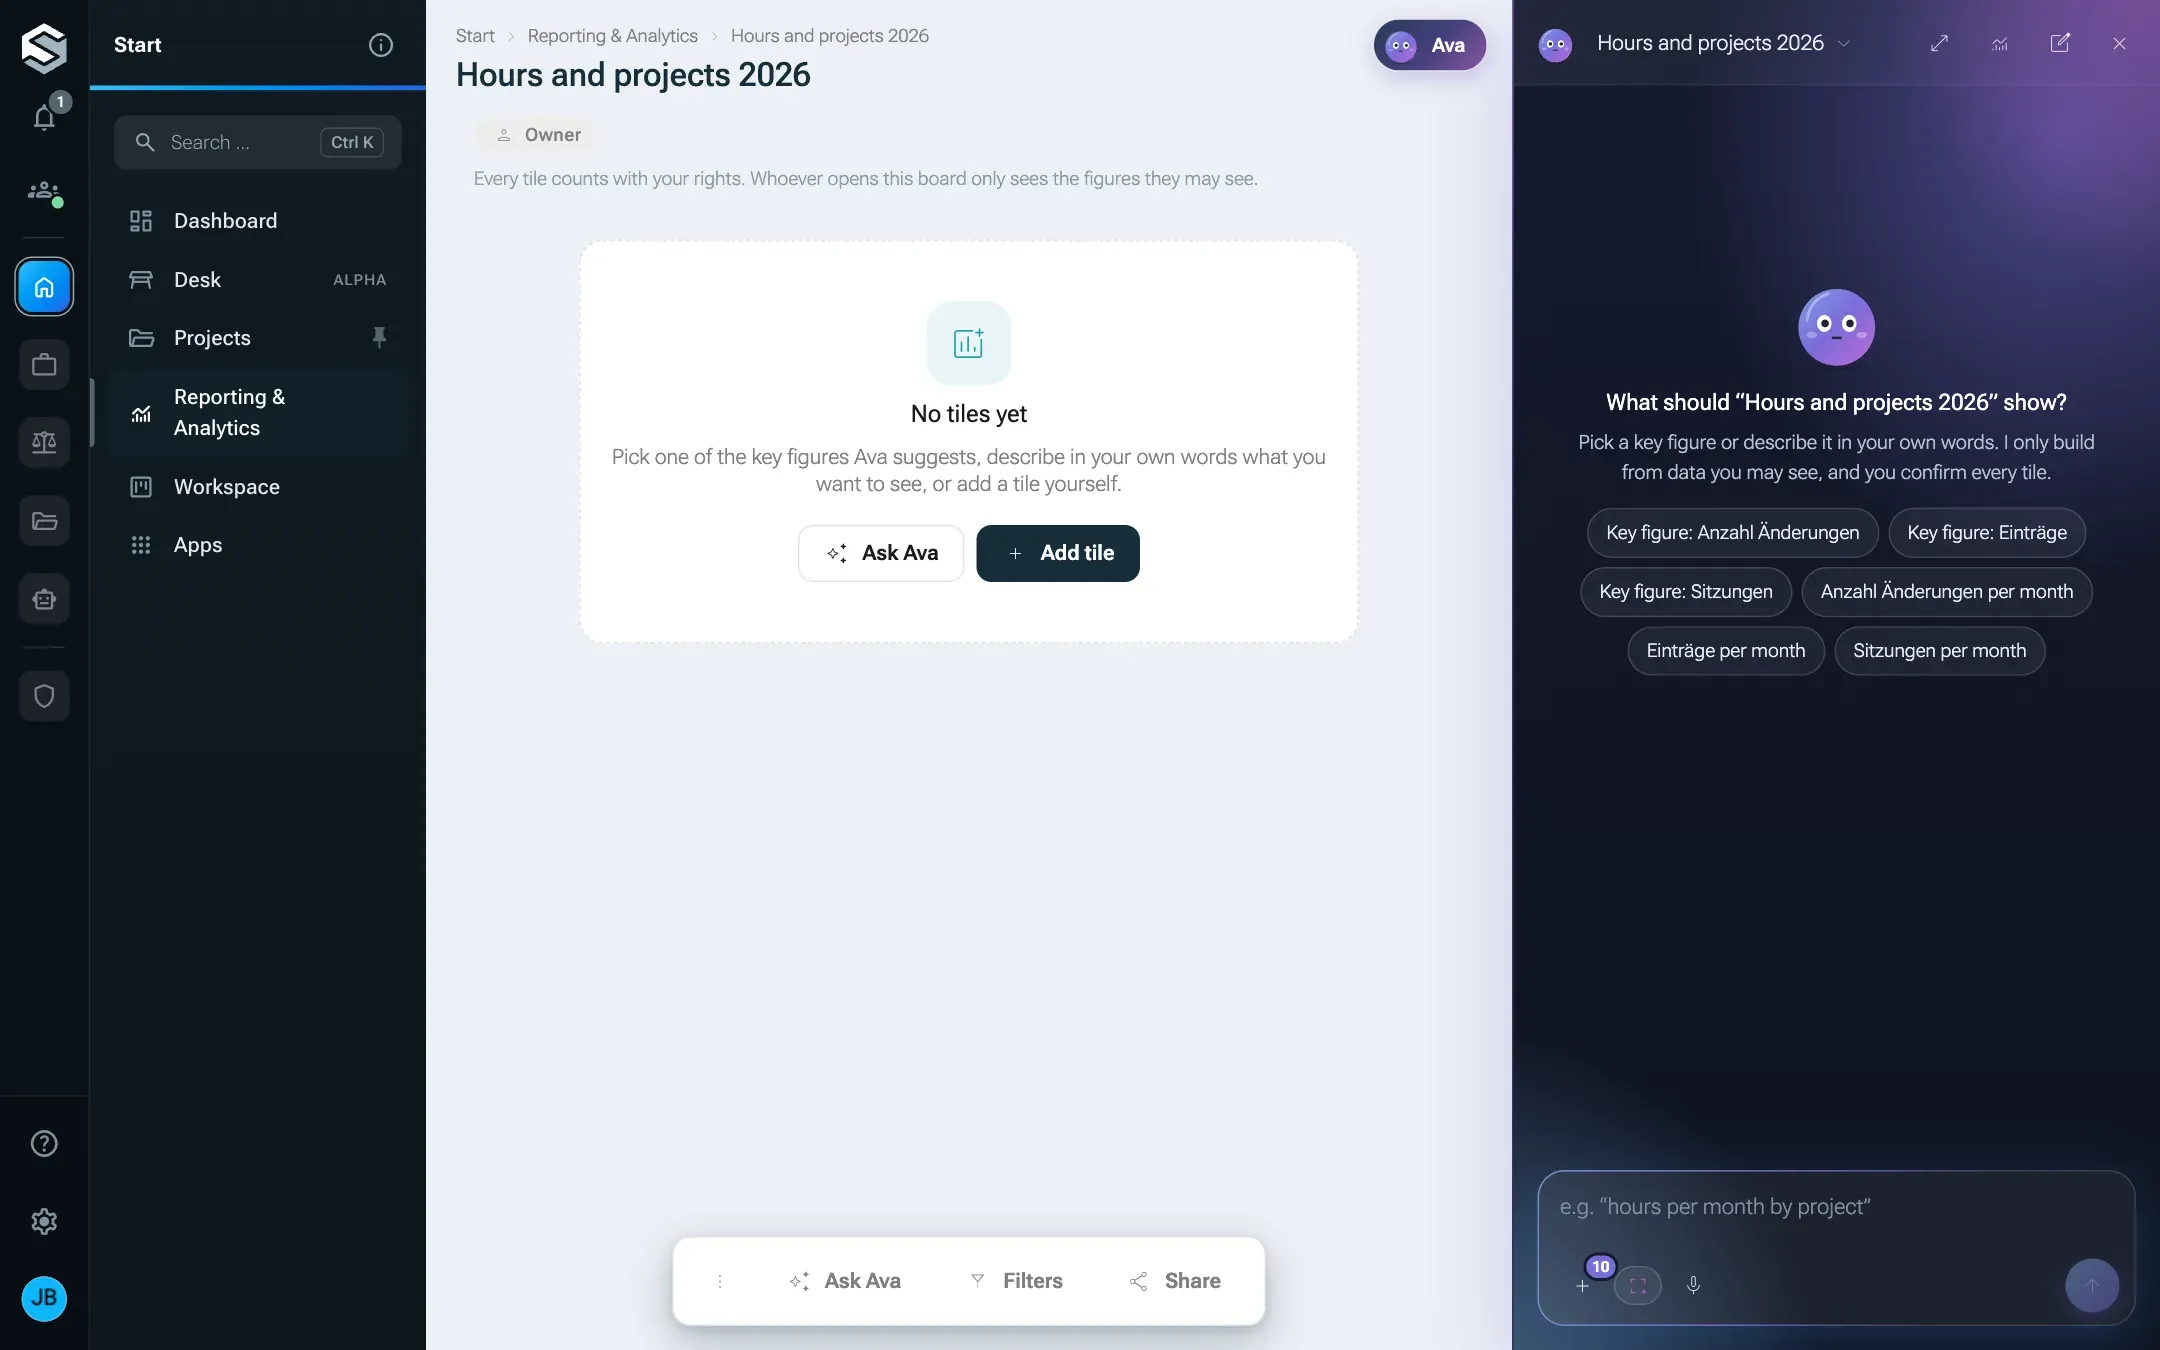
Instead of asking the AI Assistant you can add tiles yourself: Add tile on the empty board, or Customize and then Add widget. That opens the dialog Set up report, the same as on the dashboard.
The buttons of a board are at the bottom of the page: Ask AI Assistant for everyone, Filters and Customize for everyone who may edit, PDF once there are tiles, and Share for the owner. More actions holds Rename and, for the owner, Delete.
Key figure tiles
Section titled “Key figure tiles”Every key figure tile is a query in the query language NQL: one source, one or more figures, optionally fields to group by, and filters. The NQL reference describes how a query is built. You don’t need to know it; the AI Assistant and the tile dialog write it for you.
Displays
Section titled “Displays”| Display | For | What the query needs |
|---|---|---|
| Figure | One single number, “how many in total” | One figure. With a field, the tile adds up all rows; for an average that makes no sense, and the dialog points it out |
| Bar | Comparing values, such as projects per customer. Stacked stacks several series, Horizontal turns the axes for long names | A field for the axis |
| Line | A trend over time. Area stacks several series as areas | A date field with a time grain (day, week, month, quarter, year) |
| Doughnut and Pie | Shares of a whole | Exactly one field and exactly one figure |
| Table | Exact values, several fields | Nothing special; a tile shows the first 12 rows |
Several series in one tile come about in two ways: through a second field (the series are its values, for example per billing model) or through several figures (the series are the figures). A tile shows at most six series. With more values the query keeps the strongest and puts the rest together as “Sonstige” (other); that series is always grey. Empty values show as Not set.
Numbers on the axes and in the tooltips follow your language, in English with a thousands comma (2,000), in German with a dot (2.000).
Conditions
Section titled “Conditions”A key figure tile’s conditions narrow down what it counts: only approved absences, only entries of the last 30 days, only your own. You join them with “and”, “or” and “not” and nest them in groups, in the tile’s dialog under Conditions. How that works is described under Conditions with and, or and not. You can also ask the AI Assistant for it, for example “only approved ones, and only this year”.
The conditions stand as a sentence below the tile, so everyone on the board sees what is counted. The filters above the board are added to them, they do not replace the tile’s conditions.
Label values readably
Section titled “Label values readably”Some values look technical in the data, such as the object type in the audit log (app.modules.core.migration.MigrationStatus) or a constant like SPECIAL_LEAVE. A tile can label them without changing the data: as a short class name (MigrationStatus), in words (Migration Status), with a template like “Level 3” or with fixed names per value. Ask the AI Assistant for it, for example “write the object types short”, or put it into the query; the options are under Label values. Filters keep counting with the stored value, but the filter list above the board shows the same labels as the tiles.
The object type of the audit log shows as the short class name by itself.
Customize
Section titled “Customize”Customize switches the board into edit mode, as on the dashboard:
- Drag tiles to another place with the mouse; with the keyboard, Enter or Space lifts a tile and the arrow keys choose the target.
- Change width sets a tile to one to four columns: Narrow, 1 column up to Full, 4 columns.
- Settings opens the tile’s dialog, Remove takes it away.
- Done saves, Cancel discards the changes of this round.
Templates holds four ready-made sets. Their names come from the server and are German in every language:
| Template | Contents |
|---|---|
| Zeiten (time) | Total hours, time entries, billable or not, hours per month and per project |
| Projekte (projects) | Number of projects and customers, projects per billing model, projects per customer (the eight largest and “Sonstige”) |
| Abwesenheiten (absences) | Requests and days, requests by status, days by type, days per person |
| KI-Nutzung (AI usage) | Sessions and messages, sessions per model and per day |
A template replaces the tiles of the board. It leaves out tiles whose source you may not read; if nothing is left, the template is not offered. Previous layout with Restore brings back the state from before the last template, once.
Views from your apps
Section titled “Views from your apps”A view tile shows what is in your connected apps: the open tickets, today’s unread e-mails, a customer’s orders. It reads through the connectors you may use and can add figures from your own data.
Build a view tile
Section titled “Build a view tile”The AI Assistant builds views. On a board you may edit, describe a list from your apps, for example “my open tickets with status and due date”. The AI Assistant looks up which fields the app returns, builds the tile and shows it on a card you confirm. Nothing happens before that. To change a view tile, tell it what should be different; that comes as a card too.
The AI Assistant decides per figure which kind of tile fits: a number from your tenant’s data becomes a key figure tile; data from your apps, tables with status, targets, last year’s values or forecasts become a view tile.
What a view tile can show
Section titled “What a view tile can show”- Tables with their own columns: status as coloured badges, numbers and dates formatted in your language, text coloured by threshold, a totals row, links, and sorting by a click on a column header. Long tables show a part first and the rest behind Show all 24.
- Charts, combined ones too, with target and forecast lines.
- Lists like the lists in nexxus itself, with status, the person responsible and dates.
A view tile looks like the rest of nexxus and has no look of its own. It refuses its own colours and fonts: status, highlights and charts take the system’s colours, so they match the dark theme and your company’s colour.
The tile belongs to its board
Section titled “The tile belongs to its board”- Who sees it: everyone the board is shared with, in the same role. You don’t share a view tile on its own.
- With which data: each person sees their own. The tile reads with the rights and the account of whoever looks at it, not with those of the person who built it.
- For how long: when you remove the tile or delete the board, the view and its versions are gone. The data in your apps stays untouched.
Every view tile also has its own page, /analytics/view/ plus its number. At the top, Tile on “Name” leads back to the board; Versions shows every saved state and brings back an earlier one without losing anything.
The first time you open it
Section titled “The first time you open it”If someone else built the tile, you see which of your accounts it reads from before it shows anything. Until then the tile says This view still needs something from you: a confirmation or a connection. and Open.
-
Click Open. The view’s page shows This view reads data from your accounts, who built it, and the connectors it reads from.
-
Click Got it, show it. nexxus remembers this in your profile and only asks again when a new version reads from another app. From then on the tile shows your data on the board too.
-
If an app is not connected to your account yet, it says … is not connected yet with Connect account. Until you connect, that part stays empty; the rest of the view already shows.
If a connector is not shared with you at all, the view says … is not available to you, and that part stays empty.
Filters
Section titled “Filters”Filters sit in a row above the tiles. Whoever may edit a board decides which filters there are; which values apply, each person chooses for themselves. The choice is not saved, and a colleague sees their own.
Set up filters
Section titled “Set up filters”-
Click Filters. The dialog Filters for “Name” lists the fields of all sources on the board, with their kind: Period, Choice, Yes/No or Text.
-
Pick the fields people should be able to filter by. Except for a period, Several values allows tick boxes instead of a single choice.
-
Click Apply.
A board has at most eight filters. Numbers and references to other modules (customer, project, employee) cannot be filtered: a query by customer answers with names, a filter would need the ids behind them. The AI Assistant can suggest and add filters, each as a step of its own on a card.
Choose values
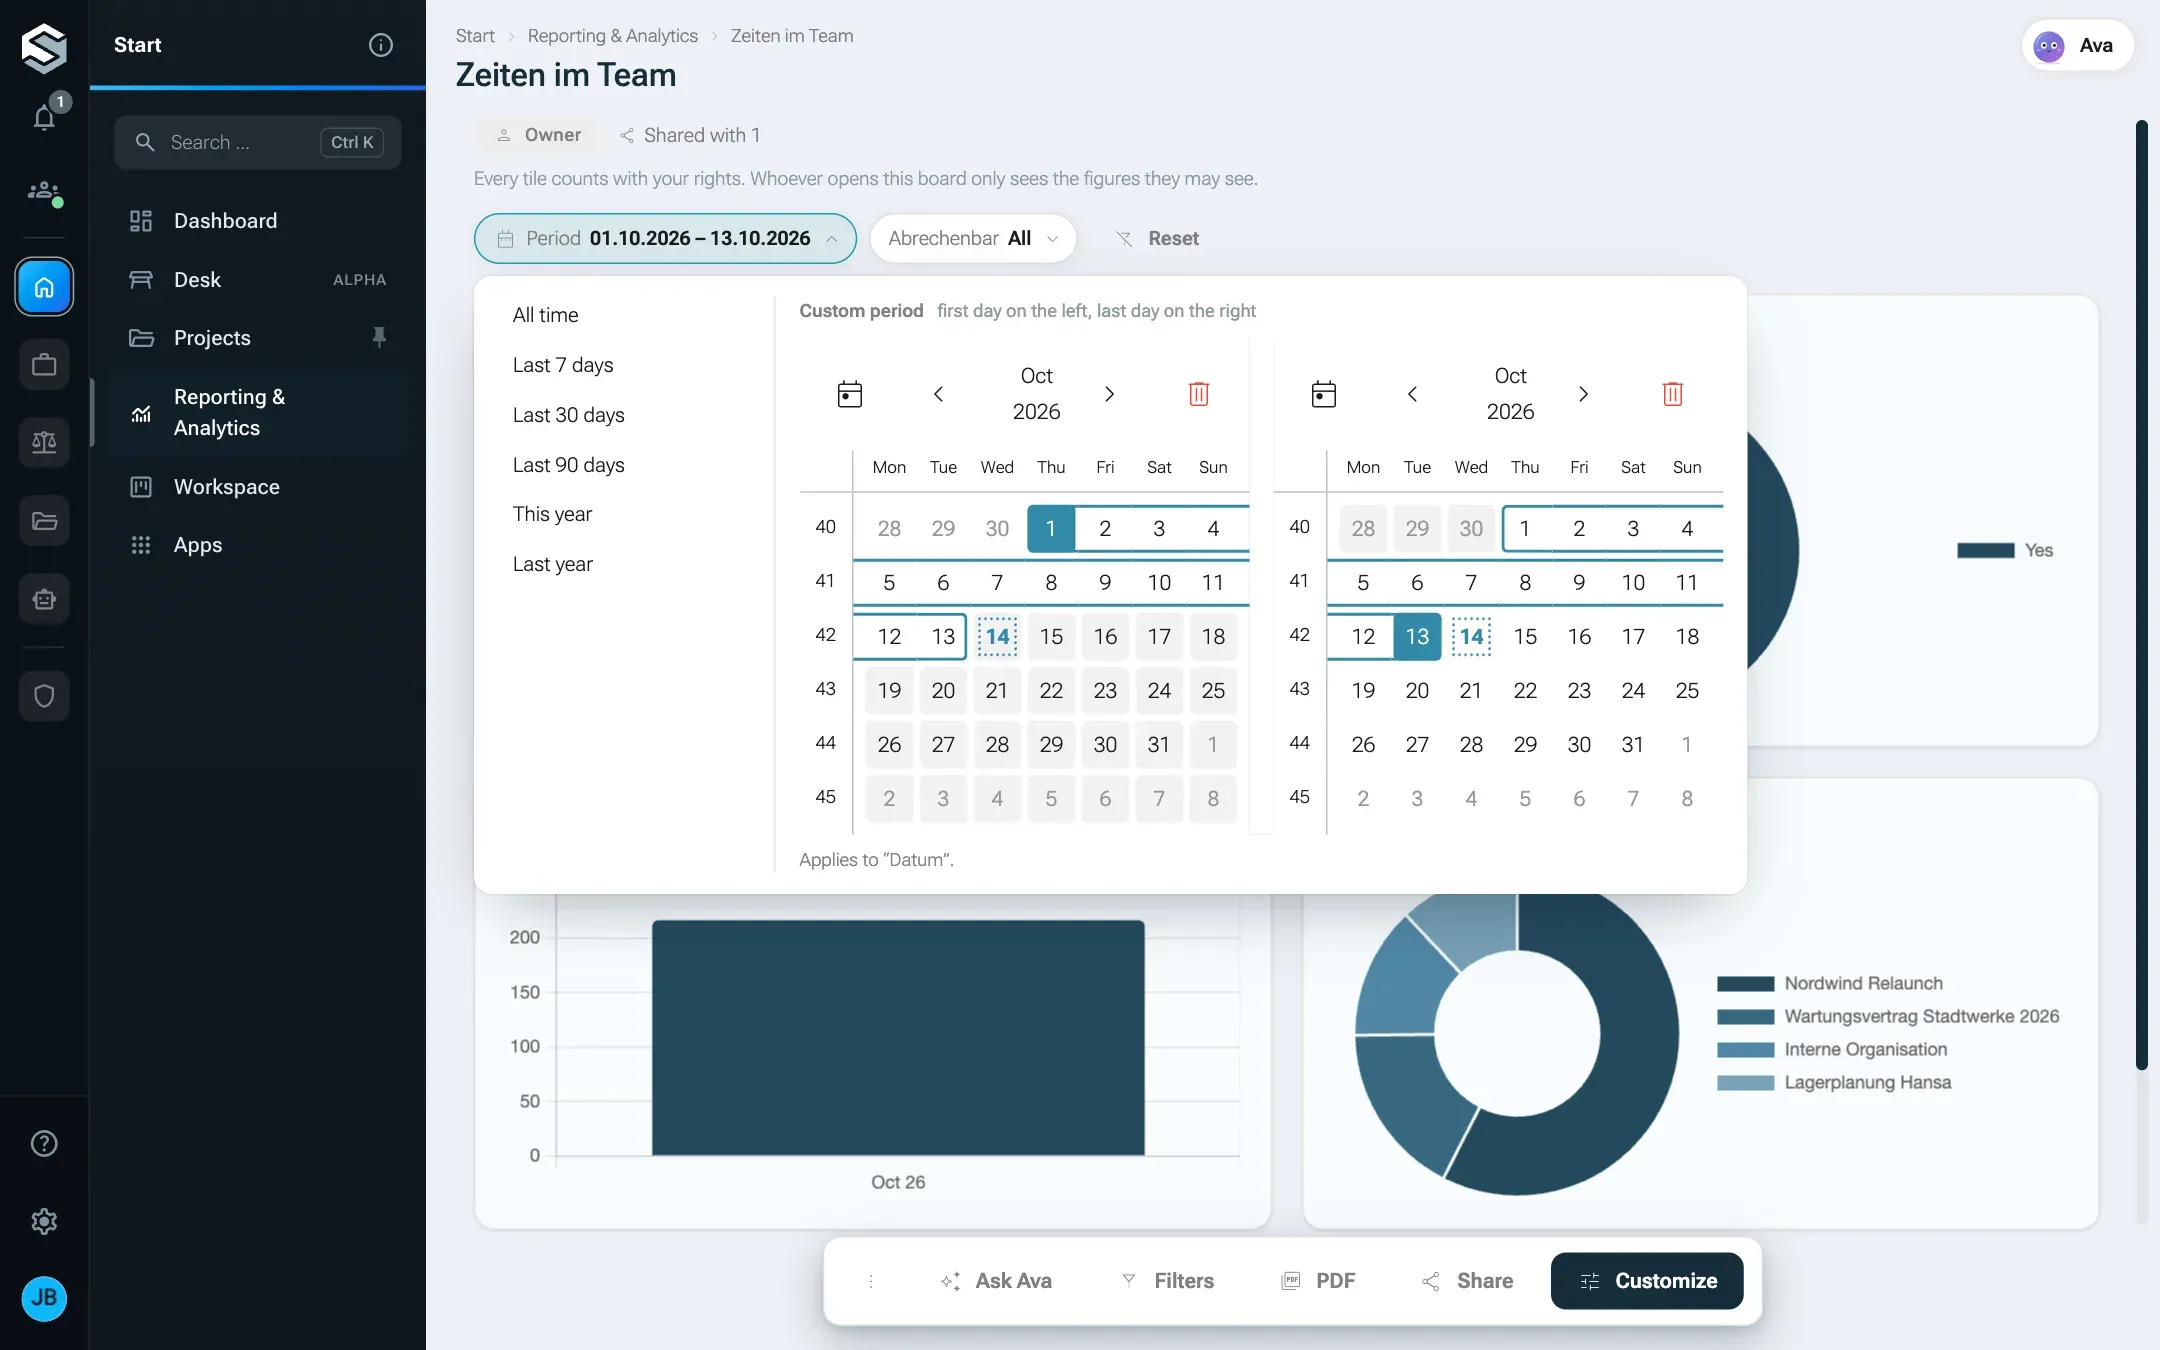
Section titled “Choose values”- Period. All date filters of a board share one button Period. It offers All time, Last 7 days, Last 30 days, Last 90 days, This year, Last year and a Custom period in the calendar: two months side by side, first day on the left, last day on the right. Starting from the whole period, the tiles change once both days are picked. The bin of each calendar empties only its own end: without a last day the period runs from the first day (from 01.10.2026), without a first day until the last (until 13.10.2026), and with neither it is the whole period again. Weeks start on Monday. On a phone the calendar shows one month with from and to to switch between. The note under the calendar says which fields the period applies to, for example Applies to „Datum“, „Angelegt am“. The last day counts in full.
- Choice, Yes/No and Text are dropdowns with the values that occur in your data. All lifts the filter, with several values also Show all.
- Reset at the end of the row lifts all filters at once. The button appears as soon as a filter is set.
A filter only acts on the key figure tiles of its own source; view tiles choose their own data and are left alone by the board’s filters. A filter on the status of absences leaves a tile about projects alone, and a period on “Datum” of the time entries does not act on “Angelegt am” (created on) of the projects unless there is a date filter for that too. It is added to the tile’s own filters, it does not replace them.
A board belongs to whoever created it. Only the owner can share and delete it.
-
Click Share. The dialog Share “Name” shows who already has access.
-
Under Choose a person pick someone from your company, choose the Role and click Share. You change a role later in the same row; Remove access takes the access away again.
-
Close with Done.
| Owner | Editor | Viewer | Everyone else | |
|---|---|---|---|---|
| See the board, filter it, download the PDF | yes | yes | yes | don’t see it |
| Change tiles, filters and the name | yes | yes | no | |
| Share and delete | yes | no | no |
You share the board, not the data. Every tile counts with the rights of the person looking at the board. Someone without the read permission of a source sees No permission for this data on that tile. A source that limits rows per person shows each person their own figures: AI sessions count only your own (administrators see all), absences your own and those of the teams you lead.
Administrators have no access to other people’s boards. A board stays private until its owner shares it. When it is deleted it also disappears for everyone it was shared with; the data itself stays untouched.
Download as PDF
Section titled “Download as PDF”PDF at the bottom of the board downloads it the way you see it right now: with your figures and the filters you chose. On a phone, PDF is in the menu More actions. Every role may do this, viewers too.
The PDF is A4 landscape and lays the tiles out in rows of four columns, as on screen. At the top are the name, “Stand” (as of) with date, time and your name, and the filters that are set; at the bottom the board’s name and the page numbers. The PDF’s own texts are German. Charts come out light on white paper, even when you use nexxus in the dark theme. A tile without figures (no permission, no data) appears with its own note. A view tile appears in the PDF as a note: A view with data from your apps. It is on the page only, not in the PDF.
nexxus queries nothing a second time for this. The page hands the server what it shows, and the server sets the document from it. So the PDF holds exactly what you were allowed to see.
With the AI Assistant
Section titled “With the AI Assistant”On a board, the AI Assistant works on that board. Ask AI Assistant opens its column; on a new or empty board you may change, it opens by itself.
- Whoever may edit can have the AI Assistant add, change and remove tiles, add and remove filters and rename the board. Every change comes as a card you confirm. It only builds from sources you may read and runs every new key figure tile once with your rights before the card appears. View tiles it builds from the connectors you may use (see Views from your apps).
- Whoever may only view can ask the AI Assistant about the figures. It explains them and suggests no changes.
- The AI Assistant can also create a new board, for example “create a board ‘Team hours’ with the hours per month”, and read your boards.
If the AI Assistant changes the board while you are in edit mode, the page says AI Assistant changed the board. It reloads once you finish customizing.
What happens behind the scenes
Section titled “What happens behind the scenes”- Every key figure tile is an NQL query that runs when it loads, with the rights of the person looking at it. The server checks the permission for reports, the read permission of the source and the fields the source publishes, and limits the rows to your tenant. More in the NQL reference.
- A board you may not open answers like one that does not exist. A number in the address gives nothing away.
- Limits: at most 40 tiles, at most 16 KB of settings per tile, one to four columns wide, at most eight filters, a name of 1 to 120 characters. In the PDF: at most 40 tiles, 200 rows and 12 columns per table, 3 MB per chart.
- A view tile runs walled off in a frame of its own with no access to the rest of the page. It asks nexxus for its data, with the account and rights of whoever looks at it, and may only call the connector actions it declared when it was built. How often it may query a connector is set by the connector; without its own setting that is 120 queries a minute for the whole tenant and 60 a minute for one person on one view, and an answer is reused for 60 seconds.
- The AI Assistant’s changes go through the same checks as the page. The steps of one card count together: if one fails, the earlier ones are rolled back too.
When something goes wrong
Section titled “When something goes wrong”| Message | Cause and fix |
|---|---|
| This board does not exist (any more), or it is not shared with you. | The board was deleted, or the share was removed. To the overview takes you back. |
| No permission for this data | You lack the read permission of this tile’s source. Ask an admin for it; the other tiles still show their figures. |
| No data for this selection. | The filters leave no row. Choose another period or Reset. |
| ”… ist für dich nur zum Ansehen freigegeben; ändern kann es …” (shared with you for viewing only) | You are a viewer. Ask the owner to make you an editor. |
| “Nur … als Eigentümer kann „…“ freigeben oder löschen.” (only the owner can share or delete) | Sharing and deleting are left to the owner. |
| “Höchstens 8 Filter auf einer Auswertung.” (at most 8 filters) | Remove a filter before you add a new one. |
| “Nach ’…’ lässt sich auf einer Auswertung nicht filtern” (cannot be filtered on a board) | The field is a number or a reference to another module. Filter in the tile’s own query. |
| “Es gibt keinen früheren Stand dieser Auswertung, der sich wiederherstellen ließe.” (nothing to restore) | Restore only brings back the state from before the last template, and only once. |
| “Der PDF-Dienst hat kein Dokument geliefert.” (the PDF service returned no document) | The installation’s PDF service does not answer. Try again later or tell your operator. |
| The assistant cannot be reached. | No AI model is connected, or the gateway does not answer. You can still add key figure tiles yourself. |
| This view no longer exists, or it is no longer shared with you. | The view was deleted, or the share was removed. Remove the tile. |
| Problems in this view: 2 | Something went wrong in the view while loading, for example because an app returns other fields than when the view was built. Let AI Assistant fix it hands it the page’s reports, and it suggests the repair on a card. |