
Work with nexxus
Build your dashboard
The dashboard is your start page in nexxus. Arrange its tiles, add key figures from your own data with the AI Assistant's help, and as an admin set the layout everyone starts with. The second half covers the desk, where your tasks, your AI avatars and the AI Assistant sit at one table.
The area Start has two pages that look at your day from different sides. The dashboard is an overview: a greeting, a field to ask the AI Assistant, your last conversations and key figures from your own data, such as hours per month or absences by type. The desk is about work in progress: the tasks waiting for you, the ones your AI avatars are working on, and what is ready for your approval.
Everyone arranges their own dashboard. An admin can save one layout as the default, so new colleagues start with something useful. At Brandt & Söhne, the managing director sets up a start page with hours per project and open absences and saves it for everyone. A technician without access to projects sees the same tile with a note that he may not see that data, and his own hours on the tile next to it.
Which layout you see
Section titled “Which layout you see”Your own layout
Once you clicked Done in edit mode, this is what you see.
The start page of your role
If you never customised yours and a package module gives one of your roles a start page.
The default for everyone
If neither of those and an admin saved a default.
The template Standard
If none of these exists.
The dashboard opens at /dashboard, from StartDashboard. It is also where nexxus takes you after you sign in. Every signed-in person can open and arrange it; no permission is needed for your own layout.
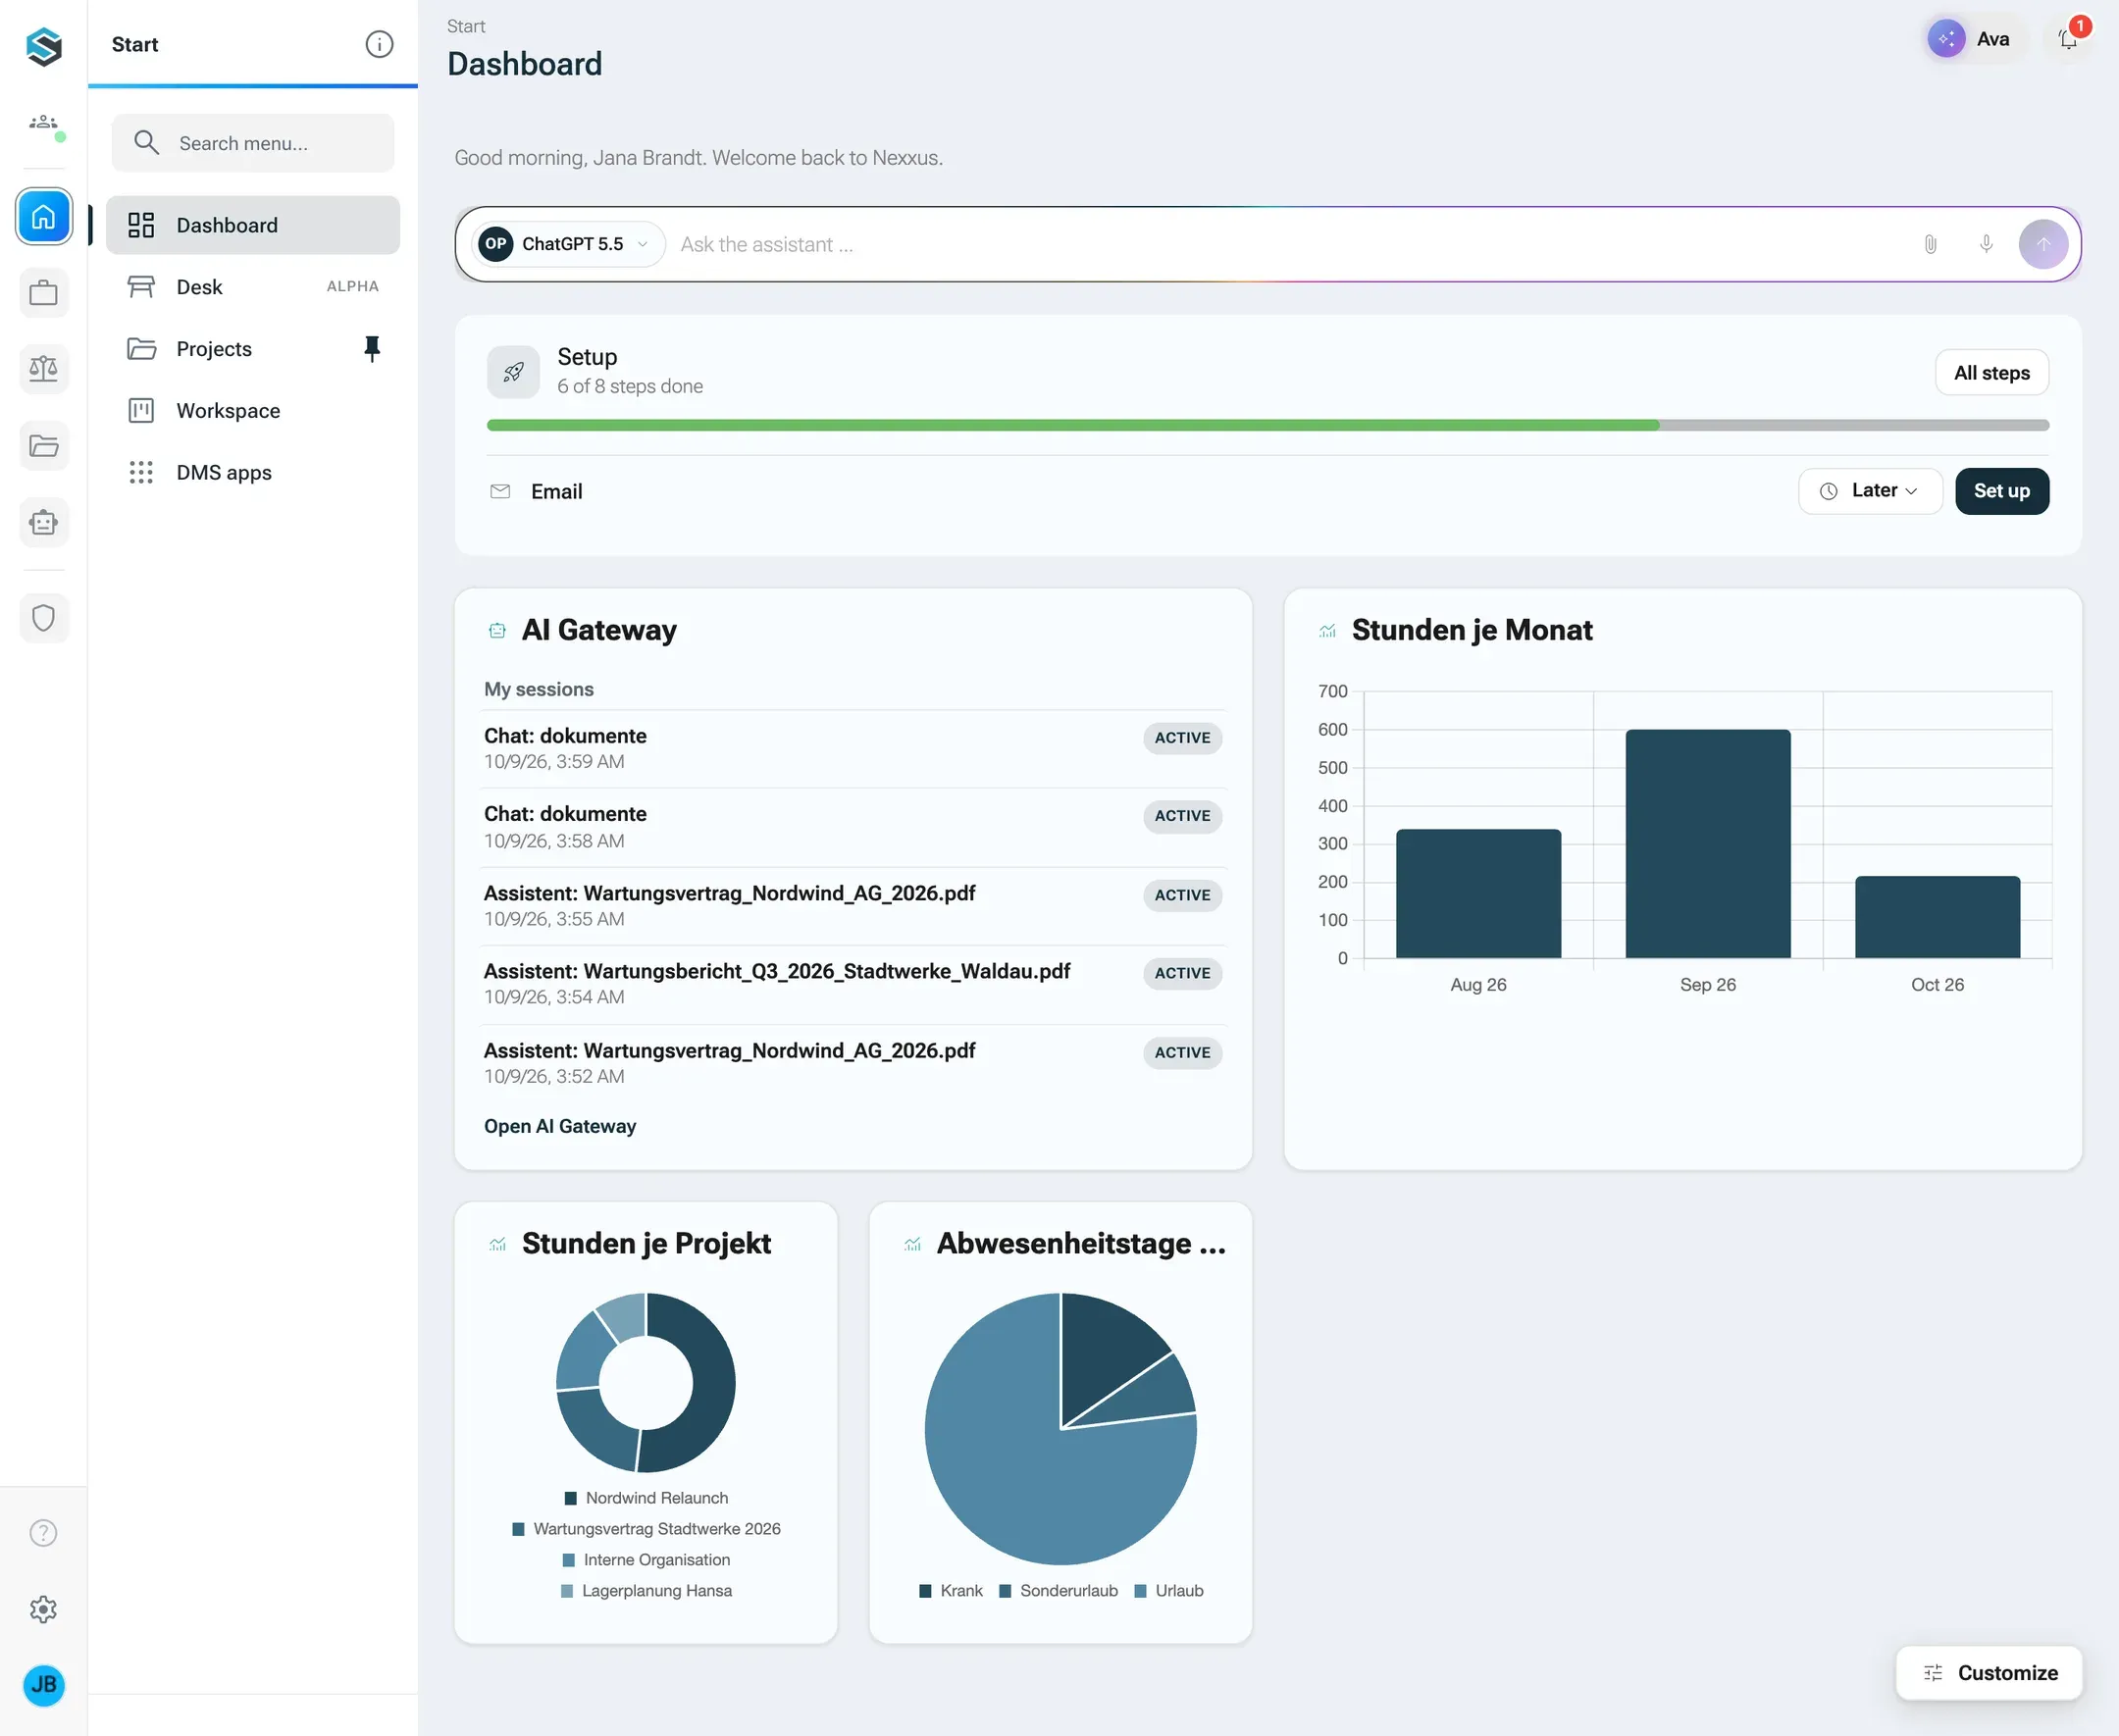
The tiles
Section titled “The tiles”| Tile | What it shows | Width in columns (min to max) | Notes |
|---|---|---|---|
| Greeting | “Good morning”, “Good afternoon” or “Good evening” with your name, and a welcome back | always 4 | Always first, cannot be removed |
| Ask the assistant | The AI Assistant as a figure, a field for a question, and what is waiting for you. The answer opens in the AI Assistant’s column, in a new conversation. | 2 to 4 | See What is waiting for you |
| Setup | The progress of the setup with the steps still open | 2 to 4 | Admins only, and only while a step is open. See First run. |
| Calendar | Your next entries of the coming two weeks, as Mine shows them in the calendar, and the link Open calendar | 1 to 4 | Needs the permission calendar.use. See Calendar. |
| AI Gateway | AI sessions: your last conversations with the AI Assistant, active ones marked ACTIVE, and the link Open AI Gateway | 1 to 2 | Needs access to the AI Assistant |
| Users | How many users the tenant has and the five newest accounts | 1 to 2 | Needs the permission to read users |
| Report | A figure, a chart or a table from your data | 1 to 4 | You can add as many as you like. See Add a key figure. |
| View | One of your views that stand on their own, with data from your connectors | 1 to 4 | You can add as many as you like. Choose a view only offers views that are not a tile of a board. See Views from your apps. |
The dashboard has four columns. On a phone (up to 640 pixels) the tiles stack in one column.
Each tile has the same states: Loading …, Could not be loaded. with Try again, Nothing here yet., and No permission for this data when the tile uses data you may not see.
What is waiting for you
Section titled “What is waiting for you”The tile Ask the assistant shows the AI Assistant as a figure; a click on it opens its column. Beside the input field (below it on a phone) the tile lists what is waiting for you: questions from your conversations and from the desk first, then unread answers, results to review and unread notifications, newest first, then your open tasks and due follow-ups in the order of the desk. The heading names the most pressing kind, for example AI Assistant is waiting for you. Four entries show, Show 6 more opens the rest.
A click opens the entry where you deal with it: the conversation, the task on the desk, or the notification’s page. With nothing open the list is not there at all. More under On the dashboard.
Customise your dashboard
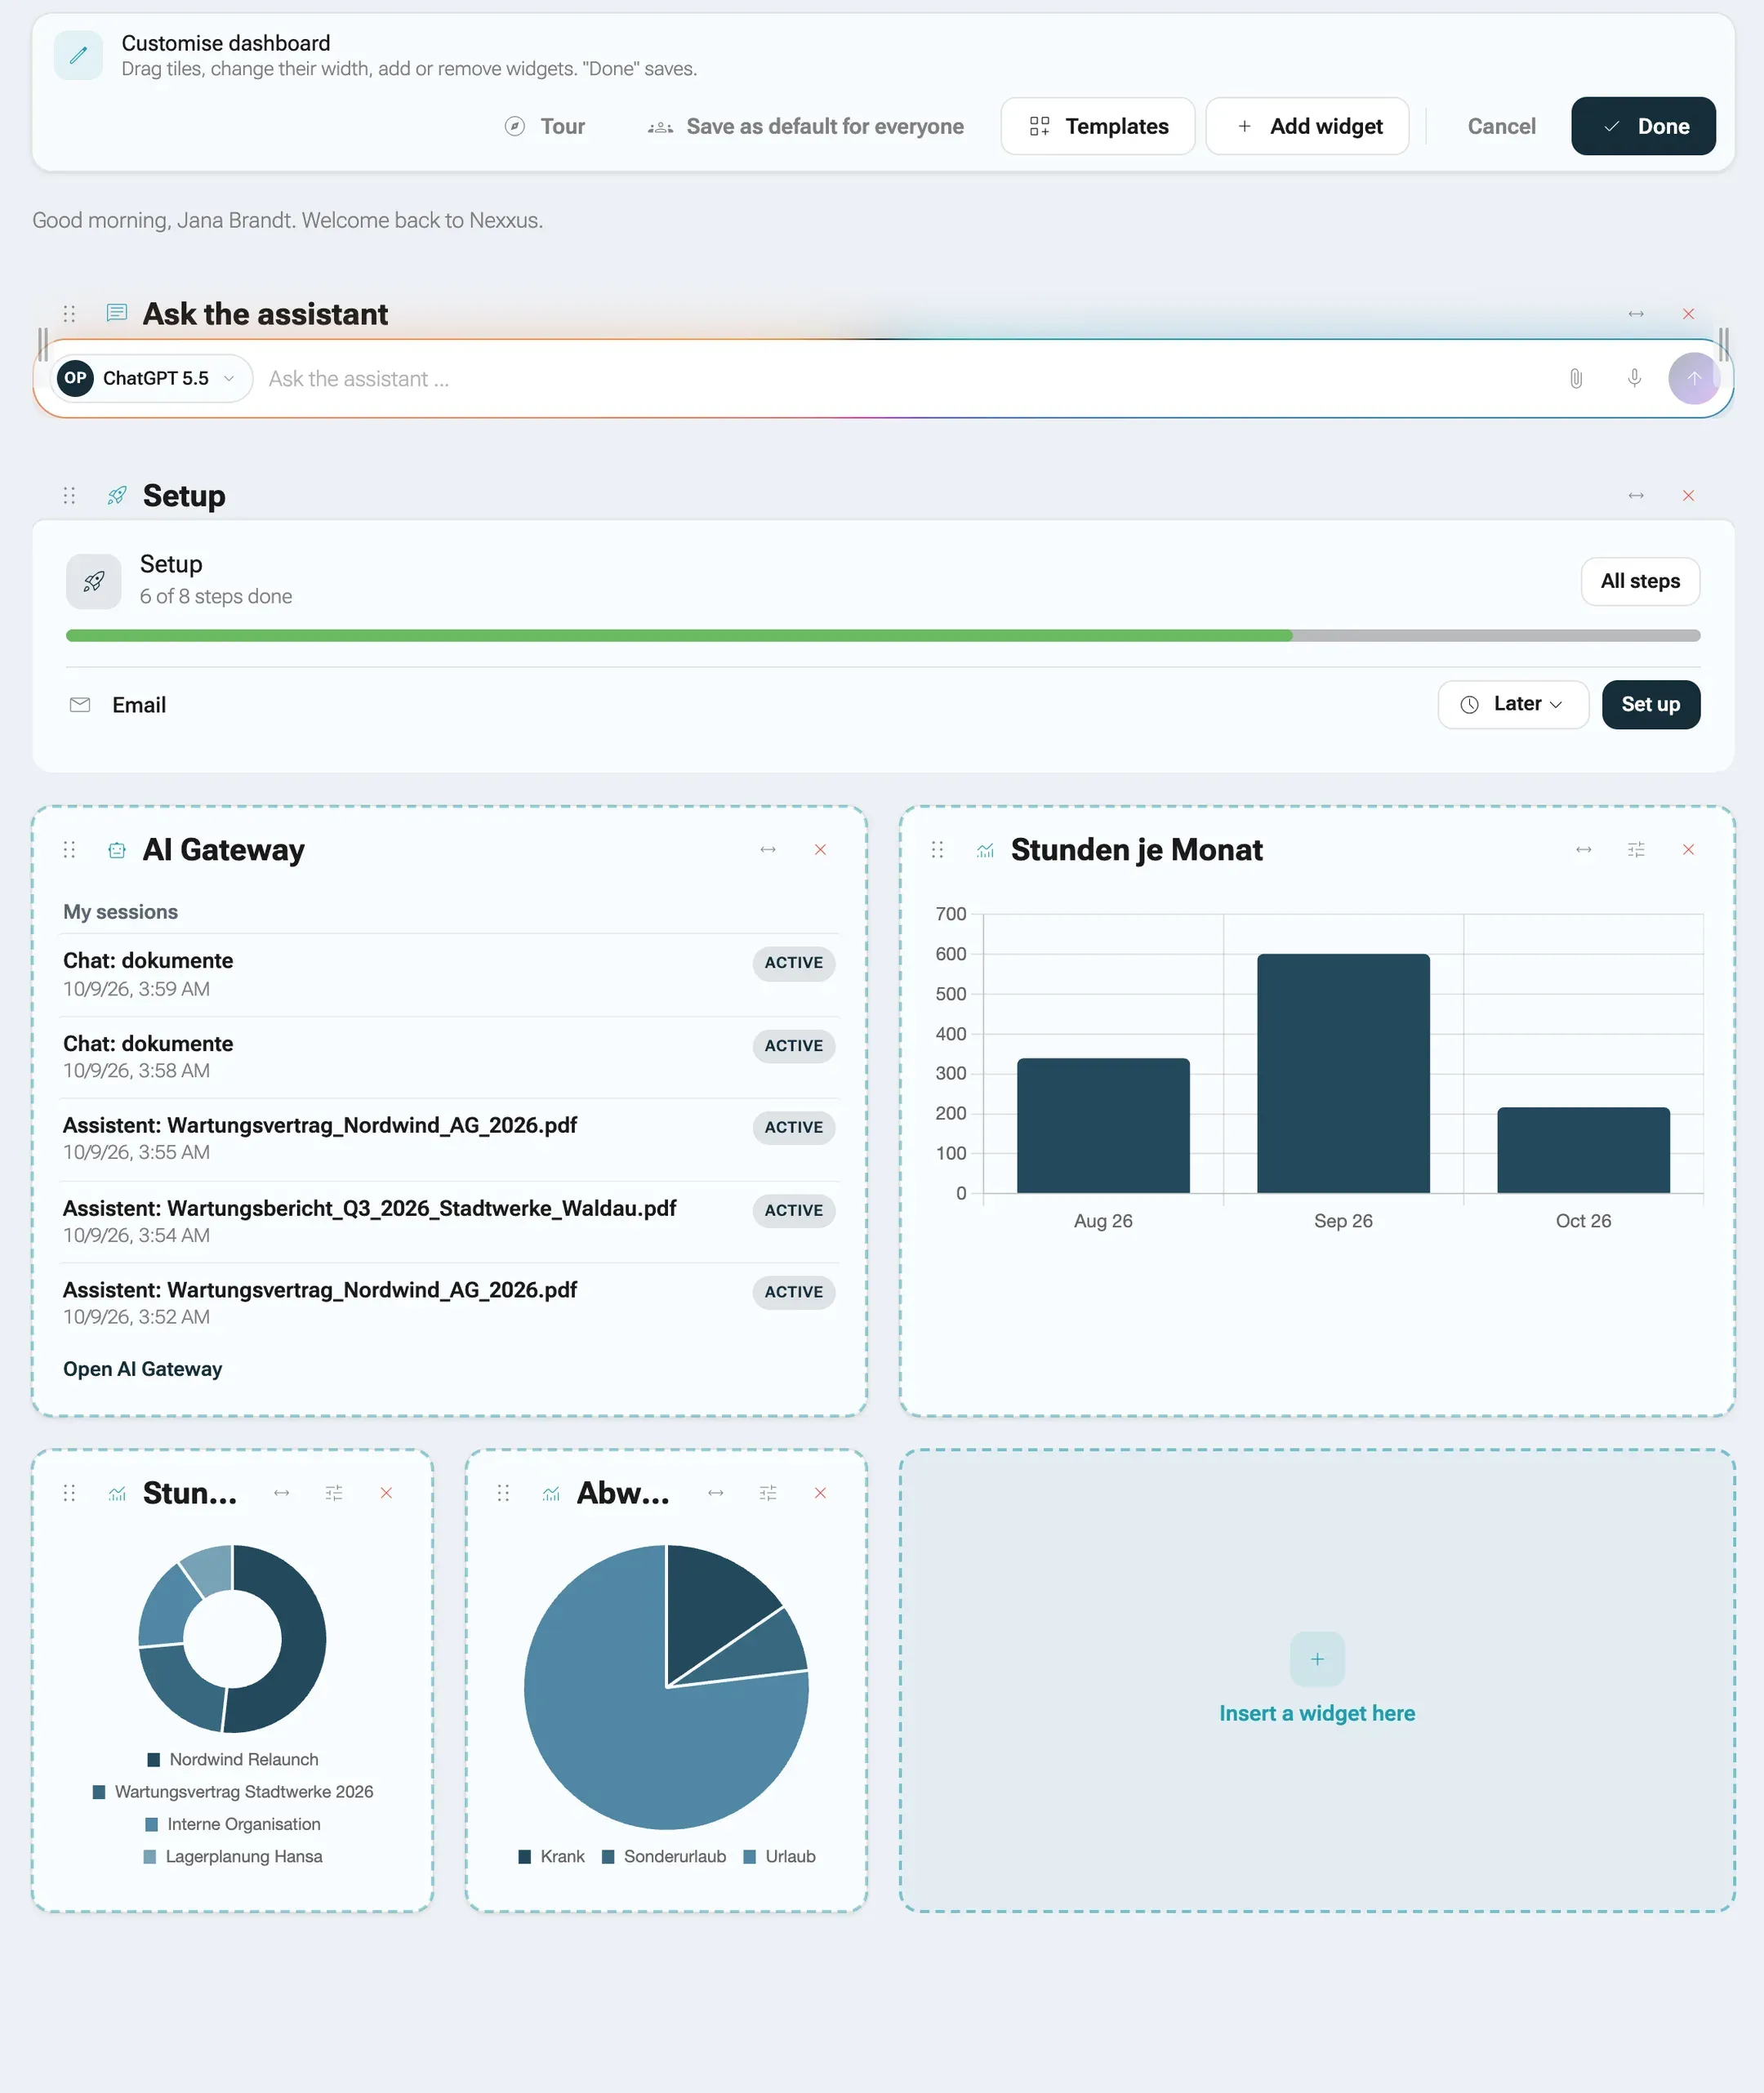
Section titled “Customise your dashboard”Click Customize at the bottom right of the dashboard. The toolbar Customise dashboard appears with the hint Drag tiles, change their width, add or remove widgets. “Done” saves. Everything you do now is a draft until you click Done.
-
Add a tile. Click Add widget. The panel Widgets opens with the tabs Widgets and Templates. Search with Search widgets, then click Add. Tiles already placed show On the dashboard, a report tile 2× on the dashboard.
Where a row has room left, a placeholder Insert a widget here appears. Clicking it inserts the widget right there and makes it as wide as the gap allows.
-
Move a tile. Drag it by its handle onto another tile and the two swap places. Drop it on a free space or between two tiles to insert it there. On a touch screen, use the handle.
-
Change its width. Open Change width on the tile and pick Narrow, 1 column, Half, 2 columns, Three quarters, 3 columns or Full, 4 columns. Only widths the tile supports are offered. With the mouse you can also drag the handles on its sides.
-
Change its settings. Tiles with something to set show a gear, Settings. Today that is the report tile.
-
Remove it. Click the × (Remove). The greeting has no ×: Always part of the dashboard, cannot be removed.
-
Save. Click Done. Cancel throws away everything you changed in this session.
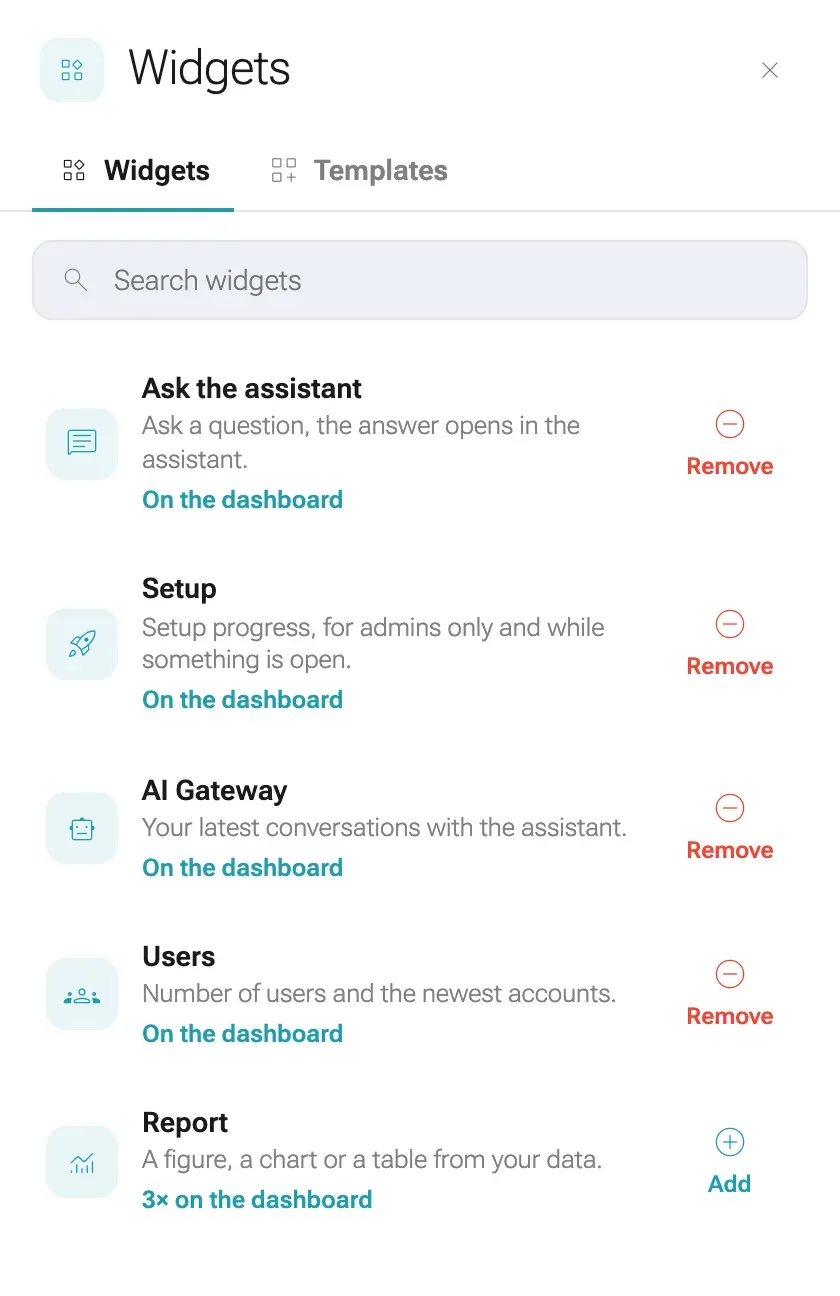
With the keyboard or on a phone
Section titled “With the keyboard or on a phone”On a tile’s handle, Enter or Space lifts the tile, the arrow keys choose a target, Enter drops it and Escape cancels. A screen reader announces each step, for example “Report lifted. Position 3 of 7.”. On a phone the tiles have the buttons Move up and Move down instead.
The tour
Section titled “The tour”The first time you open edit mode, a short tour starts by itself. It has up to eight steps; a step whose part of the screen is not shown right now is skipped: Customise your dashboard, Move tiles, Change the width, Settings, Remove, Free spaces, Widgets and templates, Done or cancel. Use Next and Back, or End tour. To see it again, click Tour in the toolbar.
Start from a template
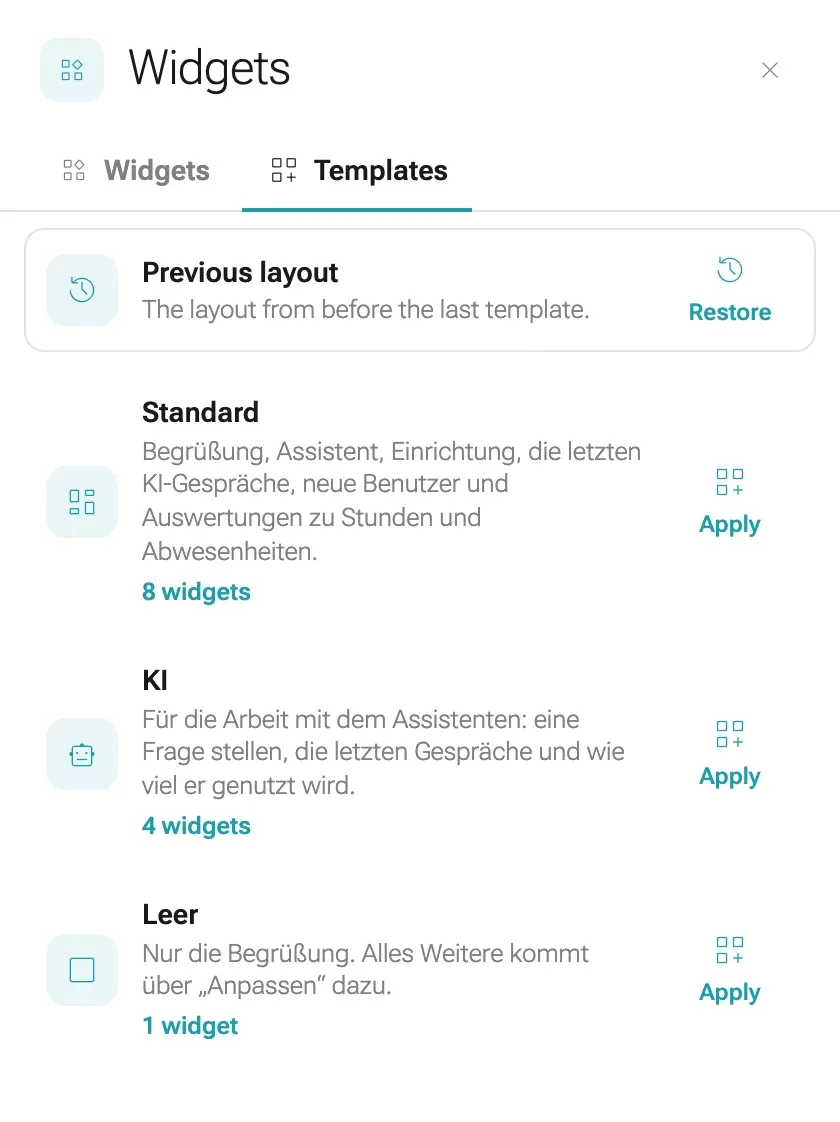
Section titled “Start from a template”A template replaces the whole layout in one go. Open Templates in the toolbar (or the tab in the panel), pick a card and click Apply. nexxus asks first: Replace the layout with “Standard”? Your current layout is replaced, including anything not yet saved. Confirm with Replace.
The templates come from the server and carry German names:
| Template | Tiles |
|---|---|
| Standard | Greeting, Ask the assistant, Setup, Calendar, AI Gateway, Users, and three report tiles: “Stunden je Monat” (hours per month, bars, last six months), “Stunden je Projekt” (hours per project, doughnut, top five plus “Sonstige”) and “Abwesenheitstage nach Art” (absence days by type, pie, approved absences only) |
| KI (AI) | Greeting, Ask the assistant, AI Gateway, and “KI-Sitzungen je Tag” (AI sessions per day, line, last 14 days) |
| Leer (empty) | Only the greeting |
Package modules can bring templates of their own, often one per role. They come before Standard and show the module’s name beside the tile count, for example 5 widgets · Module Kanzlei. You only see them while the module is active and you may use it. How a package defines them is under Start page templates.
A package template can also be the start page of a role. The card then reads, for example, Start page for Geschäftsführung. Everyone with that role who has not customised their dashboard sees this template right after signing in, without applying it, and it changes with the module’s next version. Once you edit your dashboard or apply any template, the layout is yours and stays. In a start page you did not choose yourself, tiles of a module you may not use are left out.
After applying a template, the card Previous layout (The layout from before the last template.) offers Restore. It goes back one step, not further. Once an admin has saved a default for everyone, it appears as an extra template.
Add a key figure
Section titled “Add a key figure”A report tile shows one figure, a chart or a table from your tenant’s data: hours per month, projects per customer, risks by status. You describe what you want to see, the AI Assistant proposes the query, and you check the preview before you add it.
Several figures on one topic, with filters for the period and for values, to share with colleagues and download as a PDF, belong on a board in Reports. Boards use the same tiles.
Before you start
Section titled “Before you start”- You need the permission Reports (
core.analytics.read). Every role the setup wizard creates includes it. Without it, the report tile is not offered. - You also need the permission to read the data source, for example projects or time entries. Without it the preview stays empty and the tile says No permission for this data.
- An AI model must be connected for the proposals. Without one you can still write the query yourself.
-
In edit mode, click Add widget and add Report. The dialog Set up report opens.
-
In What would you like to see?, describe the figure in your own words, for example “New projects per month, by billing model”, and click Send.
-
The AI Assistant proposes a title, a display and a query, and explains in a short box what the query counts. The question field empties for the next question. The Preview shows the result with your data right away. It writes the explanation and the proposed title in German, whatever language your interface uses.
-
Adjust the Title if you like, and choose the Display: Figure, Bar, Line, Doughnut, Pie or Table. Bars can also be Stacked or Horizontal.
-
Click Apply. The tile is placed on your dashboard.
-
Click Done to save the dashboard.
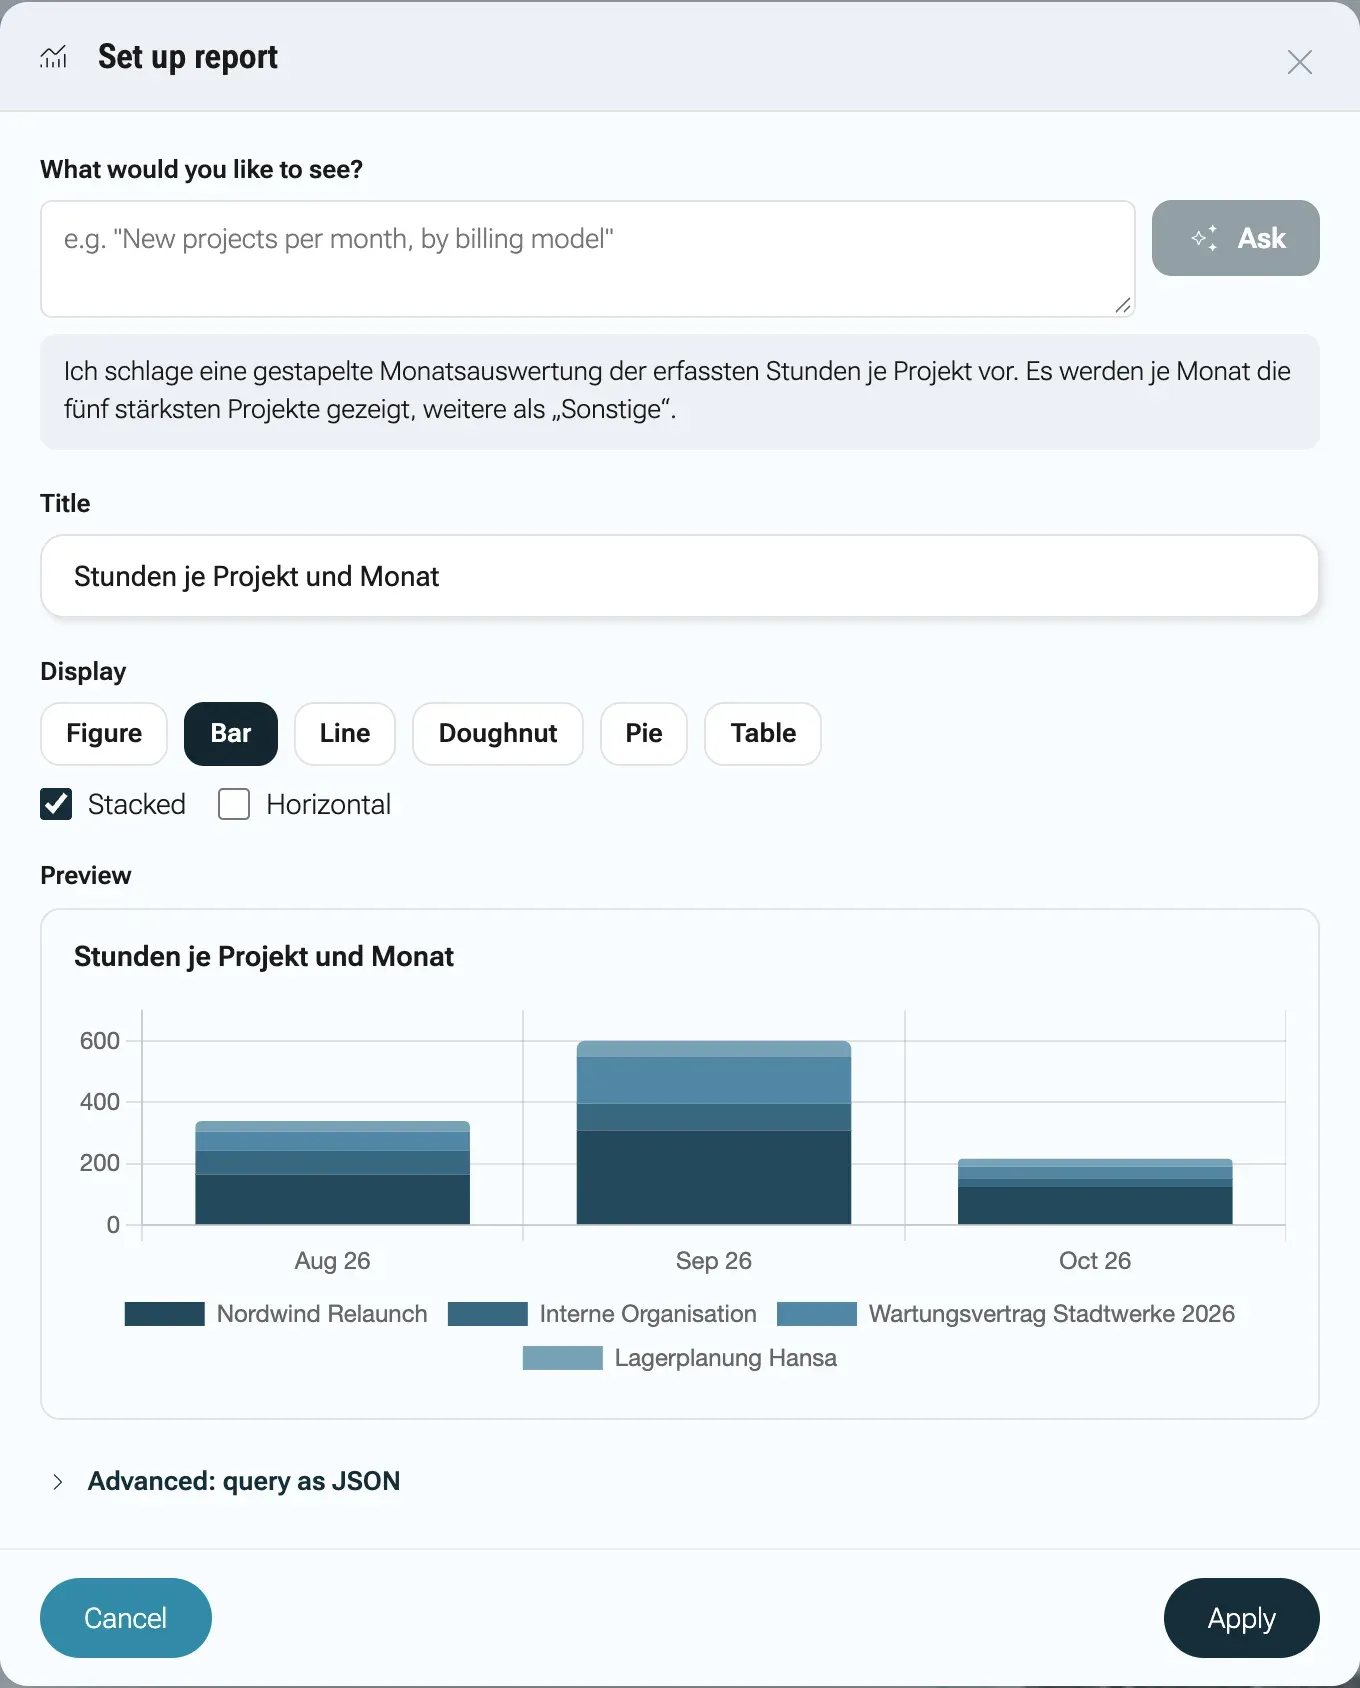
To change a report tile later, open edit mode and click its gear, Settings.
What a report tile can show
Section titled “What a report tile can show”Each report reads from one data source. The names come from the server and appear in German:
| Source | Contains | Permission needed to read it |
|---|---|---|
| Projekte | Projects | project.project.read |
| Zeiteinträge | Time entries | timesheet.entry.read |
| Abwesenheiten | Absences. You see your own requests and those of the teams you lead. | absence.vacationRequest.read |
| Kunden und Lieferanten | Customers and suppliers | partner.partner.read |
| ISMS-Risiken | ISMS risks | isms.risk.read |
| ISMS-Maßnahmen | ISMS measures | isms.measure.read |
| Formulare | Forms | formBuilder.read |
| Benutzerkonten | User accounts | authentication.user.read |
| KI-Sitzungen | AI sessions. Your own; admins see all. | ai.session.use |
| Schedule-Läufe | Runs of the AI Assistant’s schedules | aiAssistant.schedule.read |
| Protokoll (Änderungen) | The audit log | admins only |
A report picks one or more of the figures a source publishes (the number of projects, hours, absence days), groups them by a field or by day, week, month, quarter or year, filters and sorts them, can keep the top entries and put the rest under “Sonstige”, and can add shares of the total and totals. It cannot combine two sources in one chart. Periods around today such as “this month” or “in the last 30 days” are set as a condition (see below); they are worked out again every time the tile loads. The templates group by period and show the latest rows.
Conditions with and, or and not
Section titled “Conditions with and, or and not”A tile’s conditions decide which entries it counts, for example only approved absences. As soon as the tile has a query, the dialog Set up report shows the section Conditions with the conditions as a sentence. Without a condition it reads None. The tile takes every entry of the source. The names of fields and values come from the server and appear in German, so a sentence reads like “Status is Genehmigt”.
-
In the section Conditions, click Change. The sentence turns into a builder. At the top it says When, a choice and of these conditions hold. The choice offers all, at least one, none and not all.
-
Condition adds a row. Pick the field, the comparison and the value, such as “Status is one of Beantragt, Genehmigt”. A date is compared with a fixed day or with a period around today: in the last or in the next so many days, weeks or months, or in the period such as this week or last month. A field that names a person offers Me. The tile then counts, for each person who looks at it, their own entries.
-
Group adds a group with its own choice. That is how you combine “and” with “or”: “Status is Genehmigt and (Beginn in the next 30 days or Mitarbeiter is me)”. Between two rows stands the word that joins them. Clicking it switches between and and or.
-
The menu on a row (More actions for this condition) turns it into its opposite with Reverse, makes a group of it with Make it a group, duplicates and moves it. Where it fits, Compare with another field compares two fields with each other instead of with a fixed value. Rows and groups can also be dragged.
-
The Preview runs again after every change. Click Done and the sentence is back.
If a row is not finished, for example without a value, the dialog says A condition is not finished yet. Add its value or remove it to keep the tile. and Apply waits. Groups nest up to five levels deep, and a tile takes at most 50 conditions. After that it says No more conditions fit here.
On the dashboard and on a board the conditions stand as a sentence below the tile, so everyone sees what is counted. If the sentence is too long for the tile, hovering over it shows all of it. If you do not want to see it, clear Show the conditions below the tile in the dialog. The conditions still apply.
Filter opens the same builder in the lists of time entries, of users and of package modules, and your notification rules use it too. How conditions look in a query is described under Filters in the NQL reference.
Every viewer sees their own numbers
Section titled “Every viewer sees their own numbers”A report runs with the rights of the person looking at it. The same tile on the default layout shows the managing director every project and a project lead only theirs. Someone who follows the tenant’s default layout or the “Standard” layout does not get what they may not read: a report whose source they may not read, and the Users tile without the permission to read users. They see no locked tiles, and the others move up. On their own start page such a tile stays and shows No permission for this data with the note The report uses data you may not see. instead of the figures, so they notice that a permission is missing. So you can put a report on the default layout without worrying who might see too much.
Figures from an area the tenant switched off in the setup step Areas are left out the same way, such as the hours without time tracking. That holds for everyone, administrators included: the default layout and the layout “Standard” leave such tiles out, the tile assistant and the templates do not offer the source, and a query answers “Dieser Bereich ist ausgeschaltet” (this area is switched off) with the name of the source. On someone’s own start page the tile stays and shows This area is switched off with the note An admin can switch it back on in the setup under “Areas”.
Write the query yourself
Section titled “Write the query yourself”Below the preview, Advanced: query as JSON opens the NQL query behind the tile. You can edit it directly. It Runs only when you press “Preview”. This query counts active projects per month in which they were created:
{ "source": "project", "measures": [{"name": "anzahl", "as": "anzahl"}], "dimensions": [{"field": "dateCreated", "grain": "month", "as": "monat"}], "filters": [{"field": "isActive", "op": "eq", "value": true}], "orderBy": [{"as": "monat", "dir": "asc"}]}measures are the figures a source publishes (for projects: anzahl, the number of projects, and kunden, the number of distinct customers). dimensions are the fields you group by; a date field takes a grain of day, week, month, quarter or year. Only fields the source publishes can be used; anything else is refused with a list of the valid ones.
A query returns at most 5,000 rows (1,000 by default). The title of a tile may have up to 120 characters.
Every field of a query, each source with its fields and figures, and how to label technical values readably are in the NQL reference.
Set the start page for everyone
Section titled “Set the start page for everyone”-
Arrange your own dashboard the way new colleagues should see it.
-
In edit mode, click Save as default for everyone. The button only appears if you have the permission for the start page (
core.dashboard.manage, module Start page in the role editor). -
Confirm Save as default for everyone? (This layout becomes the default for everyone without their own start page and without a role that has one.) with Save. The message This layout is now the default for everyone. confirms it.
The default applies to everyone who has not saved a layout of their own and holds no role with a start page of its own. People who already customised theirs keep it; they find the default under Templates and can apply it from there.
The desk
Section titled “The desk”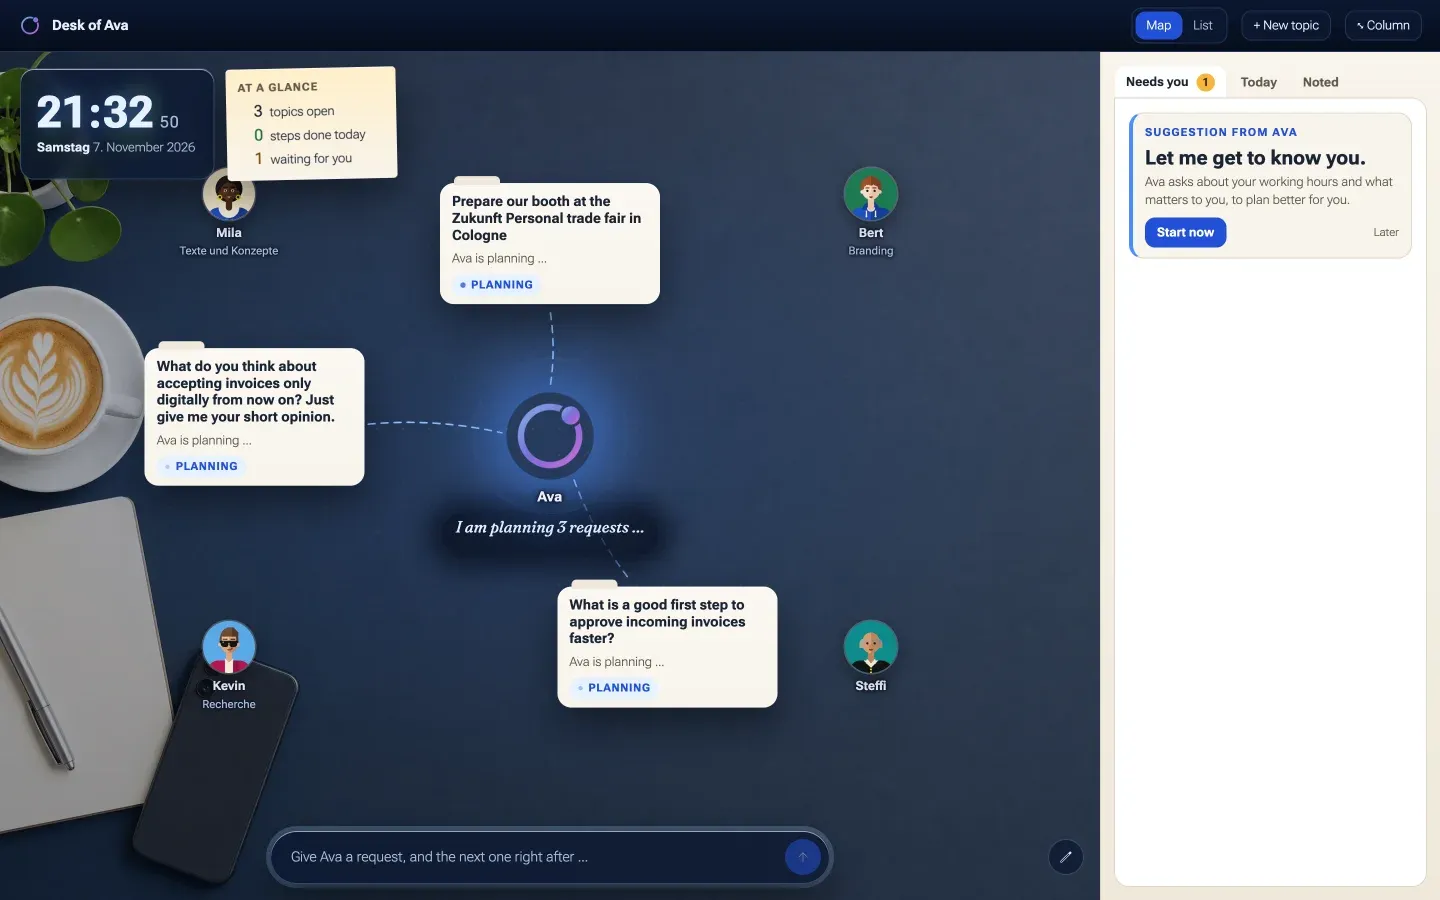
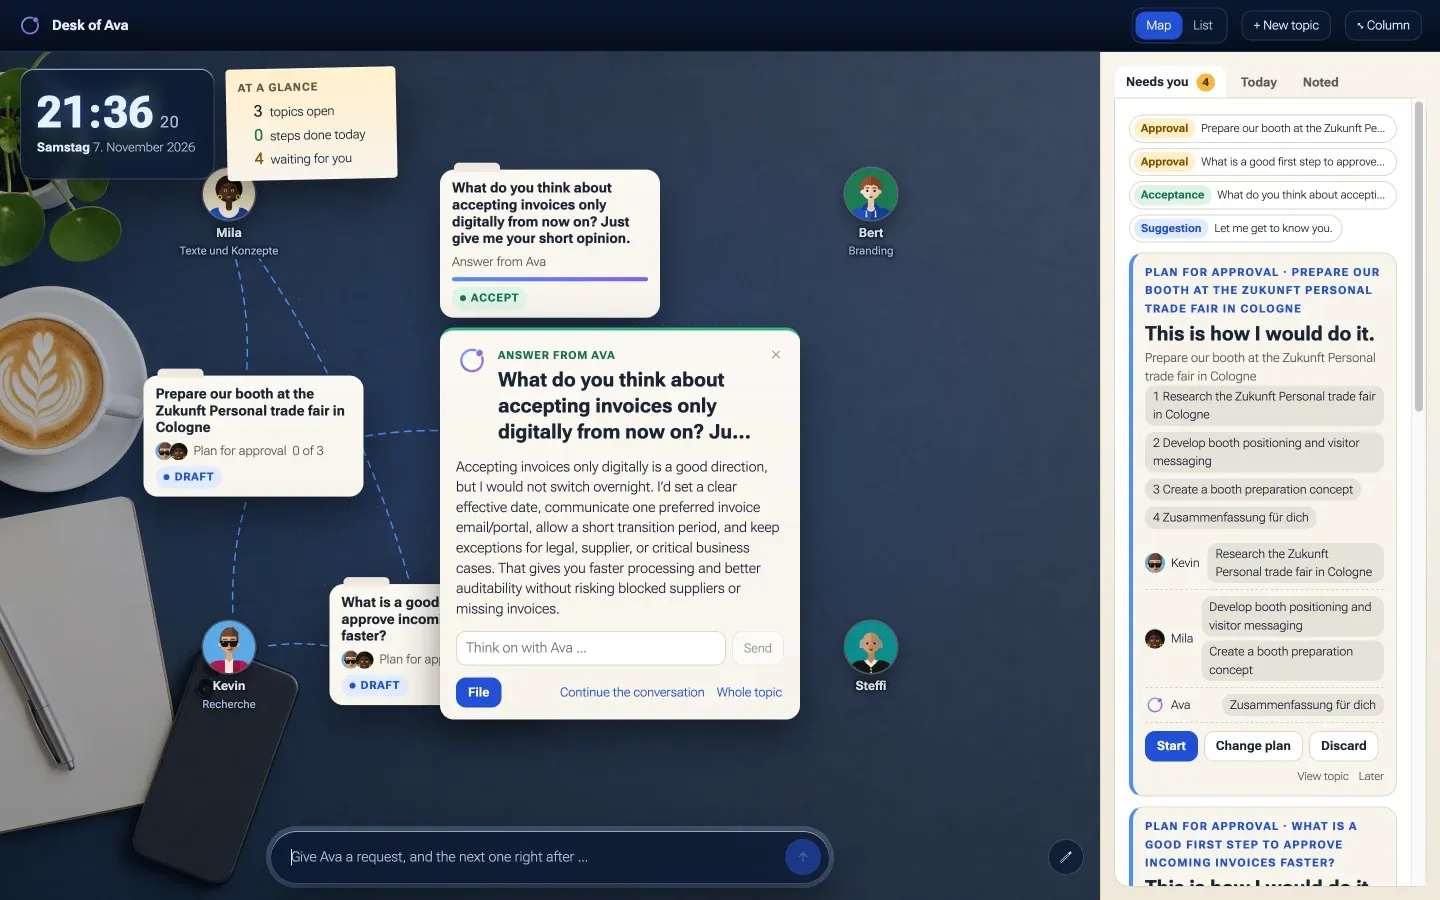
At the desk under StartDesk (/schreibtisch) you give the AI Assistant requests, and it gets them done with your AI avatars. Every request becomes a topic: a card on the table with a plan of which avatar does what. The AI Assistant sits in the middle, your avatars around it. They work in the background with your rights, and a topic comes back to you when it needs you: for the plan, a question, a confirmation or the acceptance.
The desk lies over the page, and the main menu stays beside it, folded to its rail. Open the menu and the desk moves along; an entry in the menu closes the desk and opens that page. ⤡ Column at the top right takes you back, and the AI Assistant keeps working. Below 900 pixels wide the desk looks different (see On a phone).
Who can use it
Section titled “Who can use it”Avatars only work for people who may use AI. The avatars that can join a topic’s team are the ones you may use: your own personal avatars and those shared with your unit or the whole company. An avatar in test mode only works for the person it belongs to or who is responsible for it.
The table
Section titled “The table”- At the top: Map and List switch the view, + New topic creates a topic with a team of your choice (see A topic with your own team), ⤡ Column closes the desk.
- At a glance: how many topics are open, how many steps were done today and how many things are waiting for you.
- The map: the AI Assistant in the middle with a sentence on where things stand, such as One topic needs you., your avatars with their role and what they are working on, and the topics as cards. Lines show who works on which topic. A moving dashed line from the AI Assistant to a card means it is planning that topic right now. You can move cards; their place is kept for you.
- The rail on the right with the tabs Needs you (plans, questions, confirmations and acceptances waiting for you), Today (your appointments) and Noted (what is noted for you).
- The input at the bottom: Give AI Assistant a request, and the next one right after …
- The pencil at the bottom right (Choose desk): the desktop Blue, Anthracite, Wood or Window.
Give a request
Section titled “Give a request”-
Type what needs doing at the bottom, for example “Prepare our booth at the Zukunft Personal trade fair in Cologne”, and press Enter. The topic lies on the table as a card marked Planning at once, and the input is free for the next request. The AI Assistant plans every topic on its own, several at the same time, and picks the team from your avatars.
-
When the plan is ready, a small window opens at the card, such as Plan ready · 2 steps. Under What AI Assistant assumed it says what it assumed instead of asking you first. Under Who does what each step has one avatar, with after 1 when a step waits for an earlier one.
-
Click Start. If something is off, write it in the line Something different? Tell AI Assistant … and click Change; the AI Assistant plans again. Discard puts the topic away without starting a step.
-
The avatars work, and independent steps run in parallel. The card shows Running and how many steps are done. When an avatar needs you, for a question or to confirm a change to data, the topic appears under Needs you and the card shows Waiting for you. You decide in the window at the card.
-
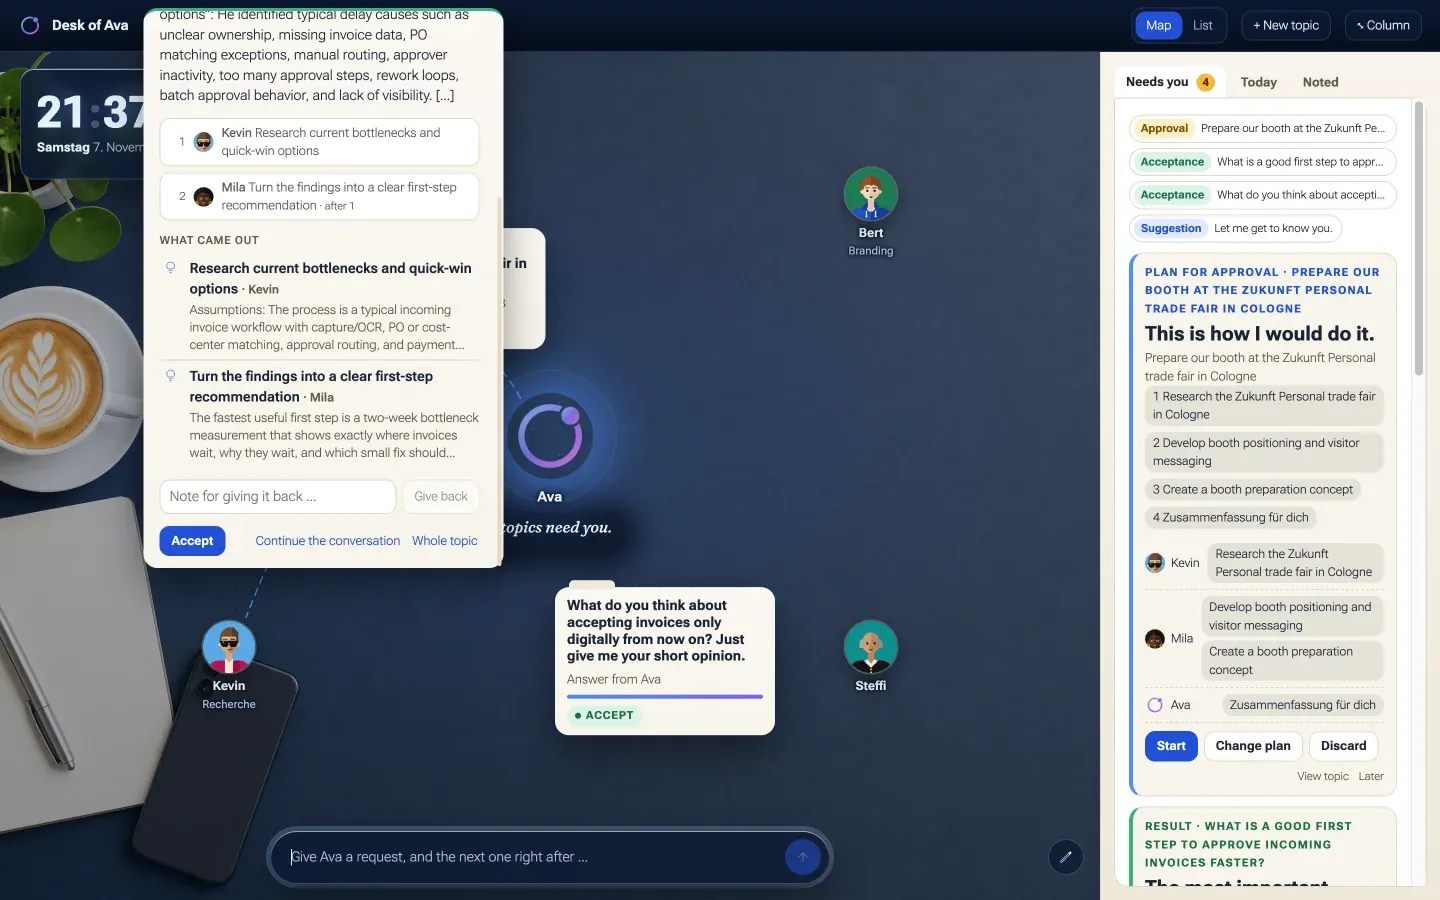
When all steps are done, the AI Assistant sums up and the card shows Accept. Check the summary and What came out, then click Accept. Or write a note and click Give back, and an avatar improves it.
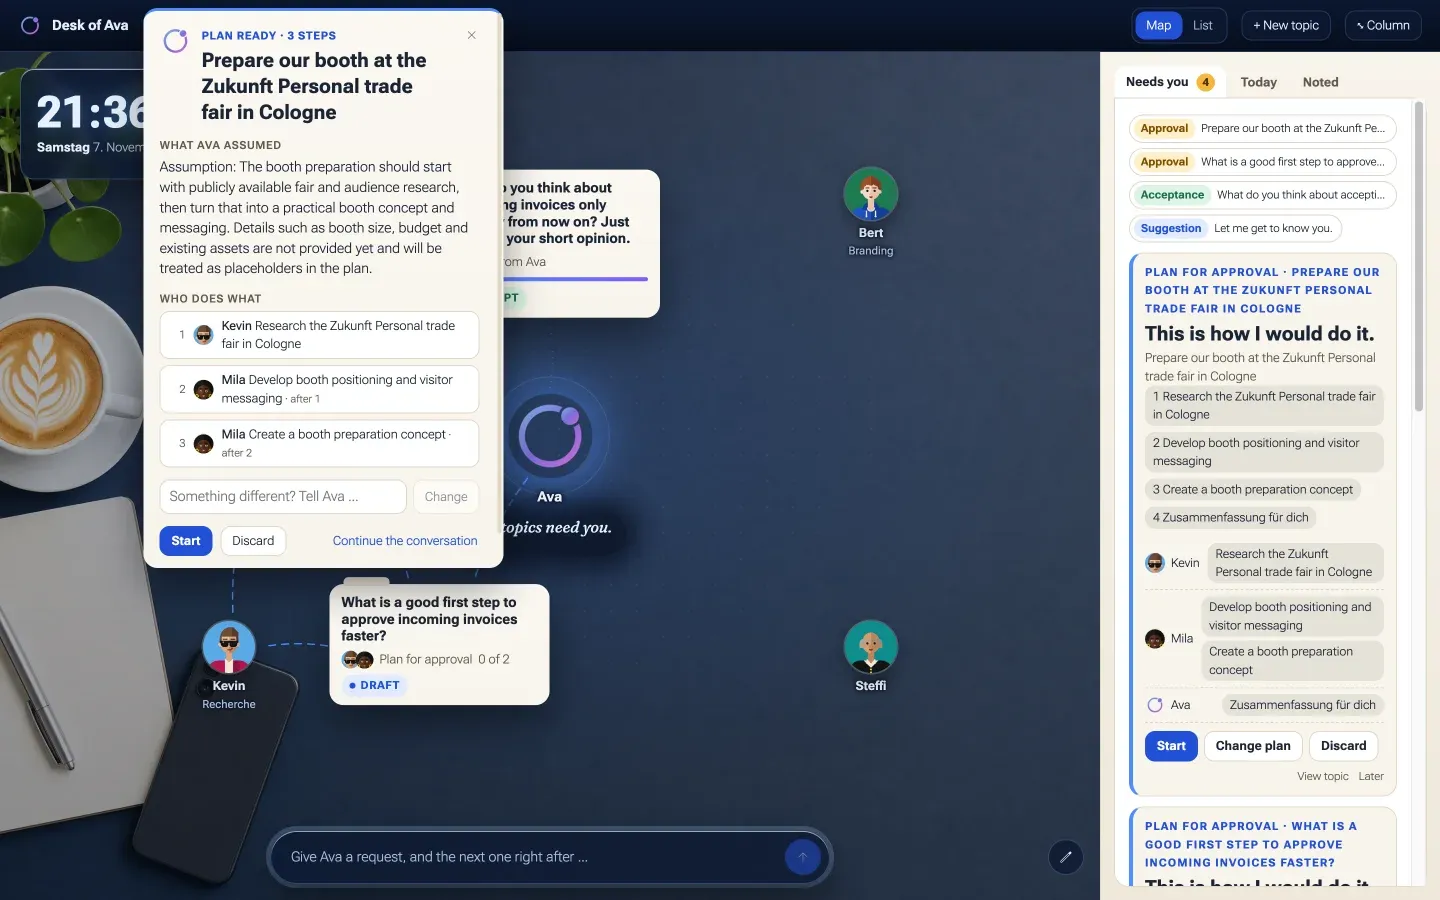
Only when nothing useful can come out without a piece of information does the AI Assistant ask first, exactly one thing. The card then says AI Assistant has a question. Type your answer in the window and click Answer; then it makes the plan.
Questions and thoughts
Section titled “Questions and thoughts”Not every sentence is a request. If you ask something or want to think something through, the AI Assistant answers directly, without a plan. The card then says Answer from AI Assistant. In the window you reply in the line Think on with AI Assistant …, or you close the topic with File. If you may not use any avatar, the AI Assistant answers a request itself too and adds that an avatar is missing for the actual work.
What came out
Section titled “What came out”In the window and in the whole topic, results are listed by kind:
- Records: when an avatar created or changed something with your confirmation, it is listed with its type and name, for example Partner: „Huber Metallbau GmbH“ angelegt (German only, meaning “Partner … created”). A click closes the desk and opens the record’s page.
- Results of the avatars: the step’s name, who did it and the first lines of the result. The whole result is in the topic.
- Documents and links an avatar attached as proof.
The window at the card
Section titled “The window at the card”A click on a card (or on a topic in the List) opens the window. What it offers depends on the topic’s state:
| Action | What it does |
|---|---|
| Start | Approves the plan; the first steps start |
| Change | Sends your line to the AI Assistant, which sets the plan again |
| Answer | Answers the AI Assistant’s question before the plan |
| Discard | Discards a plan before the start, after asking Discard the plan? |
| Cancel topic | Cancels a running topic. A step that is running finishes, and its result is discarded. |
| Accept | Closes a finished topic |
| Give back | Returns it with your note. An avatar improves it, and the AI Assistant sums up again. |
| File | Closes an answer from the AI Assistant |
| Continue the conversation | Opens the column in the AI Assistant’s conversation about this topic |
| Whole topic | Opens the whole topic: plan, history, results, proofs and costs |
A topic with your own team
Section titled “A topic with your own team”+ New topic opens a form with What is it about? and Team (optional). If you pick avatars, the AI Assistant plans with exactly those. If you leave the team empty, it puts one together as for a request typed into the input. Create topic puts the card on the table.
The AI Assistant at the desk
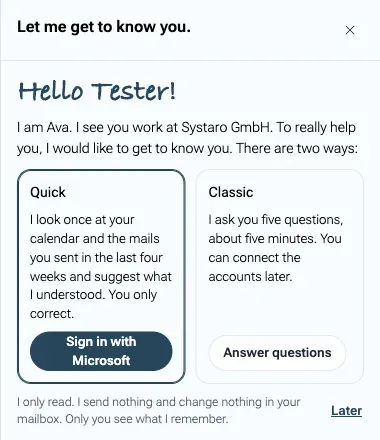
Section titled “The AI Assistant at the desk”On your first visit, Needs you shows the suggestion Let me get to know you. Start now opens the introduction, in one of two ways:
- Quick: you sign in once with your mail provider (the button names it, for example Sign in with Microsoft; if you are already connected it reads Get suggestions), and the AI Assistant reads your calendar and the mails you sent in the last four weeks a single time, then suggests what it understood. I only read. I send nothing and change nothing in your mailbox. Only you see what I remember. This needs an Outlook or Gmail connector set up by your organisation.
- Classic: five questions, about five minutes: your working days and hours, who you work with (mark the important ones with ★), what keeps coming back, where the AI Assistant should help, how it should talk to you, and how you write.
Each answer becomes a note (Noted: … with Undo). Every question has Skip. Later asks again on another day.
When a topic needs you
Section titled “When a topic needs you”When a plan is waiting for you, the AI Assistant has a question or an answer, an avatar needs your decision or a topic is finished, you get a notification in the bell. In My profile under Notifications you choose:
- In the bell: the notification appears in the bell.
- E-mail if I have not seen it for four hours: if it stays unread for four hours of your working time, a summary email follows. At most one a day.
On a phone
Section titled “On a phone”Below 900 pixels the desk shows your tasks as papers: your avatars in a row (Your team), the tasks in four tabs Yours, Running, Review and Later, and the AI Assistant in a bar at the bottom. You hand a paper to an avatar by dragging it onto them; dragging also offers Back to me and Later as targets. Topics from the big desk do not appear there as papers; you steer them on a large screen.
That is also where the notebook What AI Assistant knows about you lies, which only you can read, not even an admin. It has the tabs New, Who, Hours, People, Tasks, Style and Private. Each note says where it comes from (from your calendar, from a conversation, from you and so on) and offers Make private and Forget. The switch Keeps learning decides whether the AI Assistant adds notes from your conversations. Export everything, Forget everything and Get to know each other again are at the bottom. Notes are kept out of the audit log.
The desk and Workspace
Section titled “The desk and Workspace”Every topic and each of its steps is also a task in Workspace. The board and the task form show that they belong to the desk, but they cannot be changed there. A task you mark as private can only lie on your own desk board.
What happens behind the scenes
Section titled “What happens behind the scenes”- Layouts are stored per person; the tenant default is a layout without a person. nexxus accepts at most 40 tiles, each widget only once (except the report tile), widths within each widget’s limits, and the greeting always first. If a tile type is retired later, nexxus drops it when loading instead of failing.
- Report tiles run their query on the server, as the person looking at the dashboard. The server checks the permission for reports, the permission for the source and the allowed fields of the source, then filters by tenant.
- The AI Assistant’s proposals for a report only see the sources you may read. The server checks the proposal and runs it once as you before it reaches the preview. If it fails, the model gets one more try. Nothing is saved until you add the tile and click Done.
- The AI Assistant can read your layout and tells you which tiles you have, but it does not change the dashboard for you. It sends you to Customize.
- Avatars at the desk work with your rights, not with a service account. nexxus only carries out a change to data after you confirmed it. Every change at the desk reaches your open browser tabs at once.
- The AI Assistant plans every topic in a conversation of its own, not in your conversation with it. That is why the input is free again right away. It writes in the language of your request. If a topic goes round in circles, it stops after 4 runs per step or 24 per topic and asks you.
When something goes wrong
Section titled “When something goes wrong”| Message | What to do |
|---|---|
| The layout could not be saved. | Your draft stays open. Check the connection and click Done again. |
| The template could not be applied. | Nothing changed. Try again; if it persists, your connection or the server is the cause. |
| The previous layout could not be restored. | There is only one step back. After a second template, the first layout is gone. |
| The layout could not be saved as the default. | You need the permission for the start page (core.dashboard.manage). |
| No permission for this data | The report uses a source you may not read. Ask an admin for the permission, or remove the tile. |
| This report is not set up yet. | Open the tile’s Settings in edit mode and finish the dialog. |
| No data for this selection. | The query is valid but finds nothing, for example because a filter is too narrow. |
| The assistant cannot be reached. | No AI model answers. Write the query under Advanced: query as JSON, or ask an admin to check the AI setup. |
| The assistant made no proposal. Try phrasing the question differently. | Name the thing you count and how to group it, for example “time entries per project and month”. |
| Not valid JSON. / The query needs a source (“source”). | Fix the JSON. Every query names its source. |
| “Check quote A-2026-041 for Nordwind” is not done yet. Only what you approved goes into Files. | Wait until the paper is under To review, or approve it first. |
| You cannot see these avatars; you cannot give them anything. | The seat belongs to an avatar that is not shared with you. |
For operators
Section titled “For operators”- Background jobs of the desk are created switched off. Switch them on under AdministrationOperationsMaintenanceCron Jobs:
DESK_REMINDERsends due follow-ups to the bell,NOTIFICATION_DIGESTsends the summary emails for unread notifications,AI_USER_NOTE_DECAYlets the AI Assistant ask whether old notes are still true. - Avatar runs have a time budget of 900 seconds by default (
desk.run.timeBudgetSeconds).desk.run.defaultModelsets the model, anddesk.run.executorCoreSize,desk.run.executorMaxSizeanddesk.run.executorQueueCapacity(2, 4 and 20) size the pool of parallel runs. - Roles from before reports existed do not have
core.analytics.read. Add it to the roles that should see key figures. - How avatars appear at the desk (as figures with faces or as signets) is set for the whole tenant under AdministrationOperationsSystem configuration, section Desk, field Avatars as figures with faces.